Help us get this right
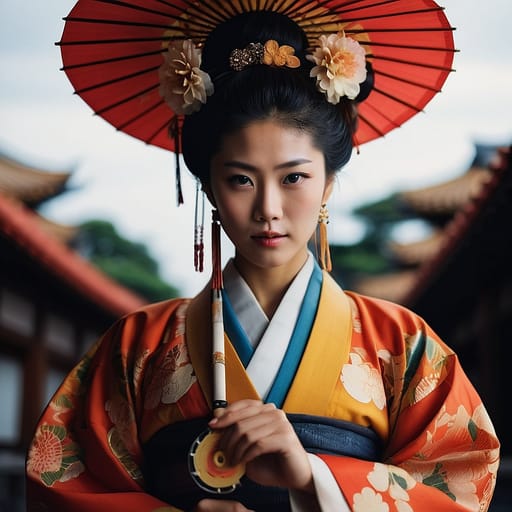
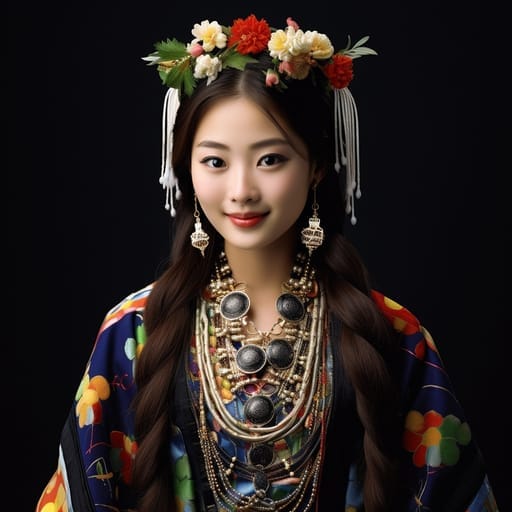
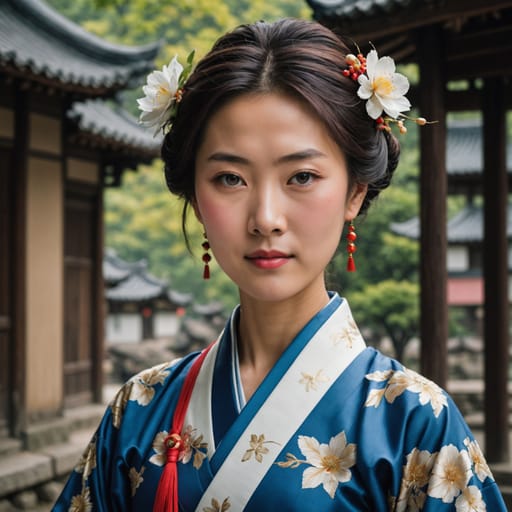
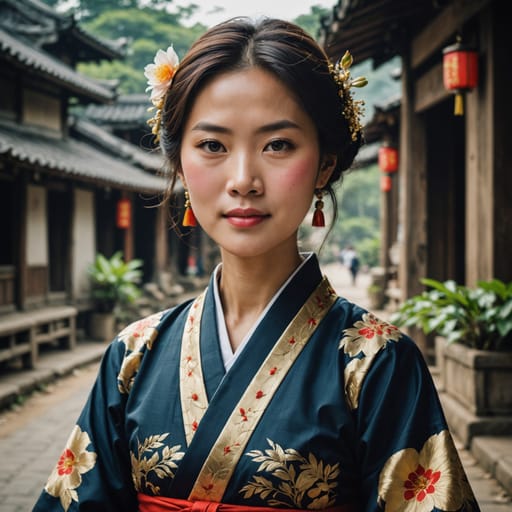
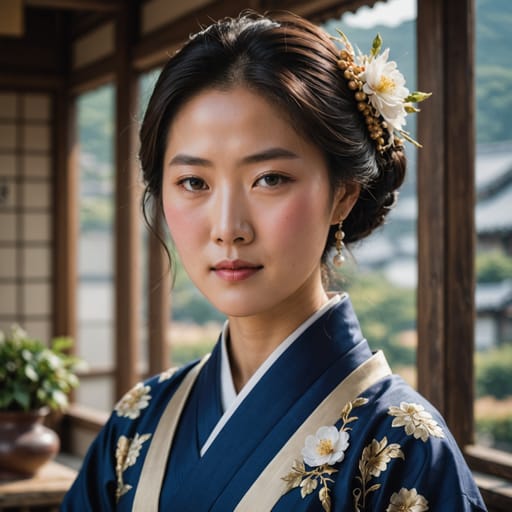
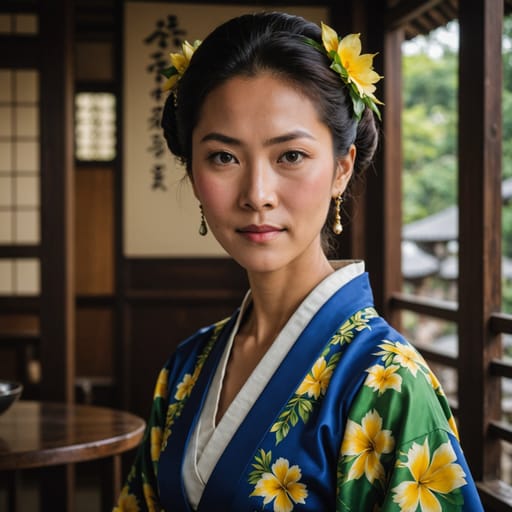
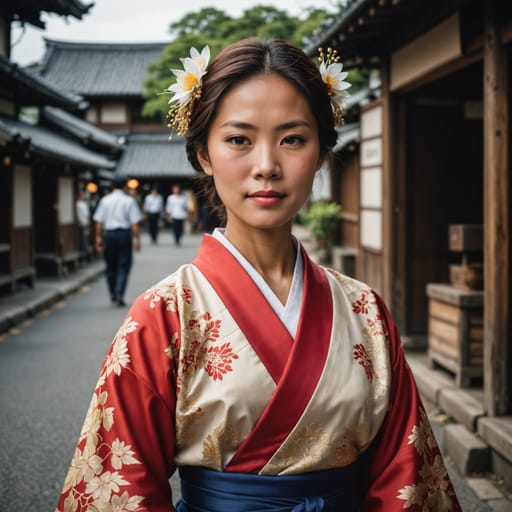
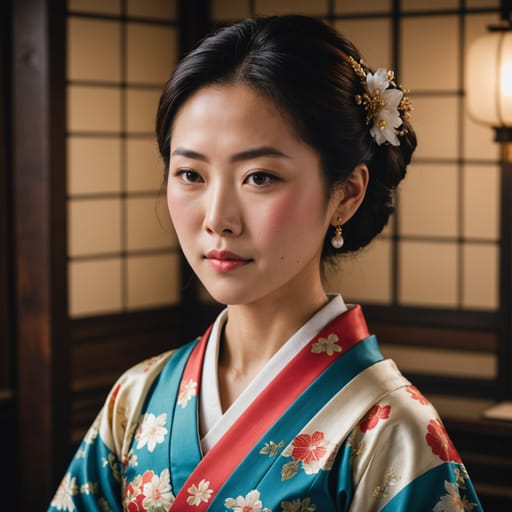
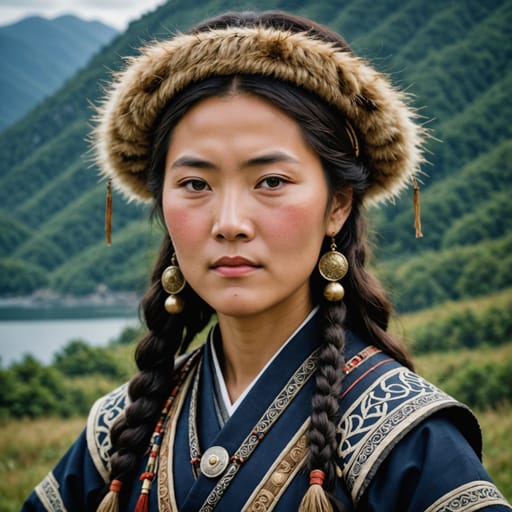
Does this portrait look right for Yamato Japanese?
Nobody has judged this one yet. You would be the first.

Japan
JPEast Asia
Japan is home to 9 documented ethnic groups in East Asia, led by Yamato Japanese (~97%), Ryukyuan (~1%), Chinese Japanese (~1%), Vietnamese Japanese (~0%). This page blends their phenotype and demographic data into one weighted reference: skin tone, facial features, hair texture and build, drawn from published census and ancestry sources.
Demographic Composition
Composition weights are derived from self-identification in published census and demographic surveys. Each row links to the source ethnic-group atlas page.
| Ethnic group | Weight | Source |
|---|---|---|
 Yamato Japanese Yamato Japanese | 97.0% | Statistics Bureau of Japan 2020 Population Census plus Ministry of Health, Labour and Welfare 2022 demographic data; Yamato Japanese (the dominant ethnic Japanese population descended from the Yayoi-era farming migration plus the older Jōmon-era hunter-gatherer foundation) comprise approximately 96-98% of the resident population. Japan does not enumerate ethnicity in its census instruments — the share is derived from nationality (~97.7% Japanese citizens) cross-referenced with demographic estimates of the small but distinct Ainu, Ryukyuan, and Burakumin sub-populations and the Korean-Japanese Zainichi population |
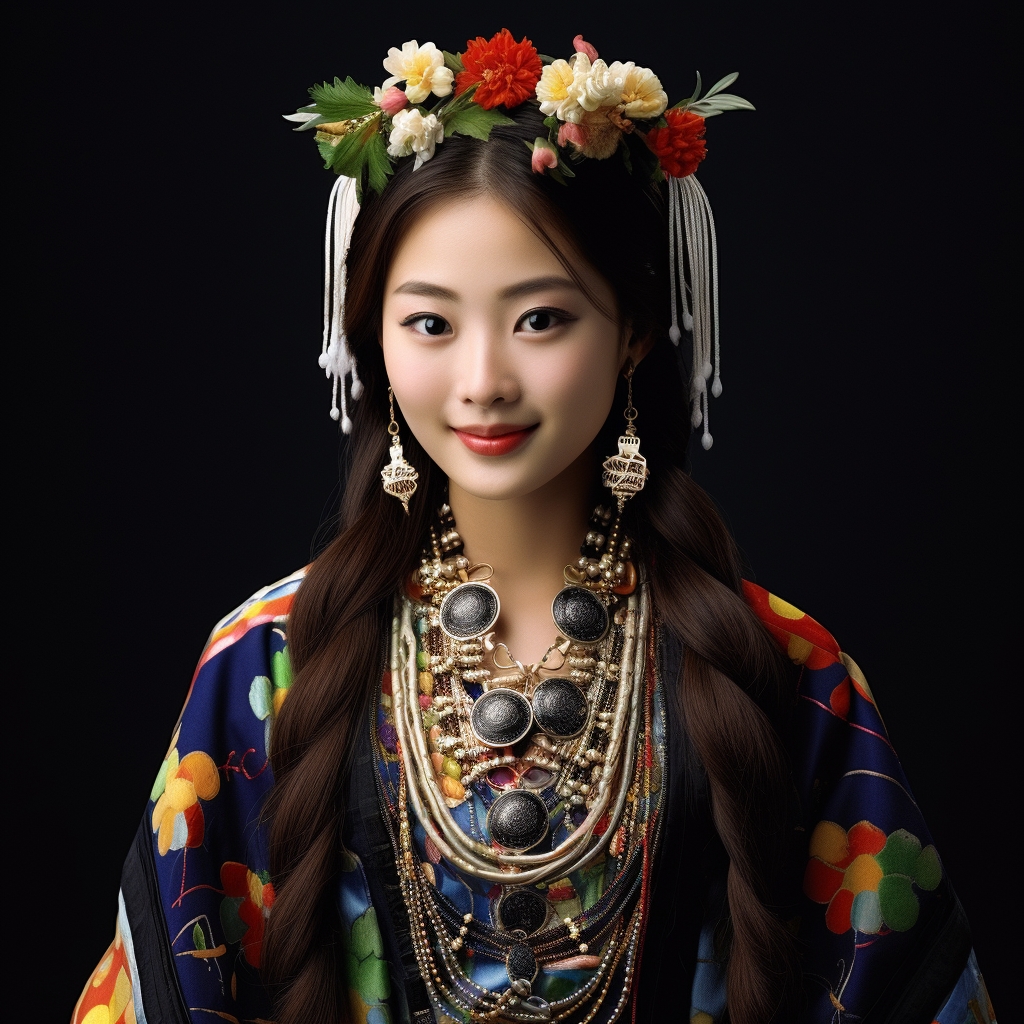 Ryukyuan Ryukyuan | 1.1% | Estimated from Okinawa Prefecture demographic data; the Ryukyuan ethnic group (descended from the historical Ryūkyū Kingdom and earlier Indigenous populations of the Ryukyu Islands) comprises approximately 1.1% of Japan's population, concentrated in Okinawa Prefecture (~1.4M residents) and the Amami Islands of Kagoshima Prefecture. Ryukyuan languages (Okinawan, Amami, Miyako, Yaeyama, Yonaguni) are distinct from Japanese though closely related (Japonic family); the Japanese government classified Ryukyuans as ethnic Japanese in the early 20th c. with substantial linguistic and cultural assimilation following |
 Chinese Japanese Chinese Japanese | 0.6% | Statistics Bureau of Japan 2020 Population Census, Chinese nationals (~810,000 residents) plus naturalized Chinese-Japanese estimated at additional 200,000+; comprises approximately 0.6% of resident population. The largest foreign-resident community in Japan as of 2020 |
 Vietnamese Japanese Vietnamese Japanese | 0.4% | Statistics Bureau of Japan 2020 Population Census; Vietnamese nationals (~440,000 residents as of 2020, growing rapidly under the Technical Intern Training Program). The fastest-growing foreign-resident community in Japan in the 2010s-2020s |
 Zainichi Korean Zainichi Korean | 0.4% | Statistics Bureau of Japan 2020 Population Census; the Zainichi Korean community (approximately 430,000 South Korean nationals plus 25,000+ Chōsen/North Korean-affiliated nationals plus an additional larger naturalized Korean-Japanese population) comprises approximately 0.4% of resident population. Descendants of Korean migrants brought to Japan during the 1910-1945 colonial period plus subsequent post-war immigration |
 Brazilian Japanese Brazilian Japanese | 0.2% | Statistics Bureau of Japan 2020 Population Census; Brazilian nationals (~206,000 residents) primarily descendants of the early-20th c. Japanese-Brazilian Nikkei population who returned to Japan starting in 1990 under the dekasegi labor migration program. Concentrated in industrial centers including Aichi, Shizuoka, Mie, and Gunma prefectures |
 Filipino Japanese Filipino Japanese | 0.2% | Statistics Bureau of Japan 2020 Population Census; Filipino nationals (~280,000 residents) plus naturalized Filipino-Japanese estimated at additional 50,000+. Concentrated in major metropolitan areas, predominantly engaged in healthcare, hospitality, and broader service-sector employment |
 Other Japanese Other Japanese | 0.1% | Statistics Bureau of Japan 2020 Population Census, residual including smaller foreign-resident communities (Nepalese-Japanese, Indonesian-Japanese, Indian-Japanese, US-Japanese, etc.) and naturalized populations not enumerated above |
 Ainu Ainu | 0.0% | Hokkaido Government 2017 Ainu Living Conditions Survey, self-identified Ainu (~13,000+ in Hokkaido plus broader Ainu-descended population estimated at 100,000+ but most do not self-identify due to historical discrimination); the Indigenous Ainu people of Hokkaido, Sakhalin (Russia), and the Kuril Islands. The Ainu language is critically endangered (fewer than 10 fluent first-language speakers as of 2020s). Japanese government formally recognized Ainu as Indigenous in 2008 (Diet resolution) and 2019 (Ainu Promotion Law). Cross-border population includes a smaller Ainu community in Russian Sakhalin |
Japan Phenotype Profile
Japan is among the most demographically homogeneous national populations in East Asia — approximately 96-98% Yamato Japanese with smaller Ryukyuan (~1.1%), Zainichi Korean (~0.4%), Chinese-Japanese (~0.6%), Vietnamese-Japanese (~0.4%), Filipino-Japanese (~0.2%), Brazilian-Japanese (~0.2%), and Ainu (~0.01%) communities. The country's demographic structure reflects the dual-source Yamato ethnogenesis (Jōmon-era hunter-gatherer foundation + Yayoi-era continental farming migration), the historical Ryūkyū Kingdom integration into Meiji Japan, the Ainu Indigenous population of Hokkaido, plus 20th c. and post-2000 immigration from Korea, China, the Philippines, Vietnam, Brazil, and other origins. Japan does not enumerate ethnicity in census instruments, so composition weights are derived from nationality cross-referenced with ethnographic and demographic estimates.
Genome-wide studies (Cooke et al. 2021, Watanabe et al. 2019, Jinam et al. 2012) document a clear east-west and north-south genetic gradient within Yamato Japanese tracking the underlying Jōmon-Yayoi ancestry gradient: Yamato Japanese in eastern Japan (Tōhoku, Kantō) carry somewhat higher Jōmon-source ancestry; western Japan (Kansai, Chūgoku, Kyushu) carries higher Yayoi/continental source ancestry. The Ryukyuan population carries higher Jōmon-source ancestry than Yamato Japanese (~25-30% vs ~10-20%), and the Ainu population carries the highest Jōmon-source ancestry of any contemporary East Asian population (~70-80%).
Skin tone across the population spans Fitzpatrick II-IV with II-III the modal value nationally. Hair is overwhelmingly straight (Andre Walker 1A-1B) and uniformly black or very dark brown across the broader population, with the Ainu showing somewhat broader hair-texture distribution (wavy to curly textures more common). Eye color is uniformly brown to dark brown across the broader population. Facial features show subtle east-west and Yamato-Ryukyuan-Ainu differentiation tracking the Jōmon-Yayoi gradient. Build is typical of Northeast Asian populations — adult Yamato Japanese mean stature has continued to increase over the 20th c. with a substantial secular trend, currently ~171 cm (males) and ~158 cm (females) in 2010s-2020s cohorts. Within-population variance is moderate; the country's regional and ethnic-minority diversity is substantial in absolute terms but small as a proportion of the broader Yamato-dominated national population.
Japan Body & Anatomy Reference
Per-feature anatomical profile for AI nude generation: East Asian Sinitic / Mongoloid phenotype dominant in Japan
Japan Women: Boobs & Breasts
Japan women's tits and boobs reflect the small-to-medium cup, modest projection East Asian Sinitic / Mongoloid bust profile dominant in the Japan demographic composition. Japan nipples and areolas show light-pink to medium-brown areolar pigmentation against the light-to-medium skin tone, with areolar diameter typically in the 26-36mm range, distinct from the the fuller South Asian or Levantine bust profile. Japan breast morphology trends firm and modestly projecting; smaller cup size than the South Asian or Western Asian average, a function of the ectomorph-to-mesomorph, lean frame body habitus and mean adult female BMI 20-23. For anatomically-accurate AI-generated Japan nude women the render should preserve: small-to-medium cup, modest projection shape, 26-36mm areolas with regional pigmentation, and the torso proportions of the East Asian Sinitic / Mongoloid phenotype.
Japan Women: Ass & Hips
Japan women's ass and hip morphology presents as small-to-medium, modest projection, narrower hip profile, distinctly different from the fuller projected glutes of the West African or Polynesian phenotype. Japan pelvic profile shows narrower iliac crests, less gluteal-femoral fat deposition, anchored in the East Asian Sinitic / Mongoloid skeletal pattern that dominates the Japan ethnic composition. Japan butt shots in adult AI imagery should render the small-to-medium, modest projection, narrower hip profile silhouette with the ectomorph-to-mesomorph, lean frame build and the gluteal-femoral fat distribution typical of the East Asian Sinitic / Mongoloid phenotype rather than defaulting to a globally-averaged shape that generic AI generators produce.
Japan Women: Vagina & Pussy
Japan women's pussy and vulvar anatomy presents light-pink to medium-brown labial pigmentation, smaller labia minora, consistent with the East Asian Sinitic / Mongoloid phenotype's pigmentation pattern dominant in Japan. Japan pubic hair is typically straight fine texture, sparser distribution than the South Asian norm, distributed in the inverted-triangle pattern with regional-typical density. AI-generated Japan nude imagery should preserve the light-pink to medium-brown labial pigmentation and the straight fine texture hair texture rather than defaulting to a Western-European pink-and-sparse template. For anatomically-accurate Japan pussy renders the labial pigmentation should match the surrounding light to medium skin tone of the East Asian Sinitic / Mongoloid phenotype.
Japan Men: Dicks & Penis
Japan men's dick and penile anatomy in adult AI generation should anchor on the regional reference data: regional mean ~11-12cm erect, moderate girth, and light-brown shaft pigmentation. Japan cock profile reflects the East Asian Sinitic / Mongoloid ancestral population's anthropometric measurements rather than a globally-averaged Western-pornography default. For anatomically-accurate Japan nude male imagery the shaft pigmentation should track the surrounding light to medium skin tone, with continuous glans-to-shaft pigmentation transition and the straight fine texture pubic-hair texture distributed in the typical inverted-V escutcheon. Circumcision status across Japan men varies by religious and cultural tradition rather than ancestral phenotype.
Japan People: Body, Curves & Build
Japan body type and overall build presents as ectomorph-to-mesomorph, lean frame, with mean adult female BMI 20-23: the characteristic East Asian Sinitic / Mongoloid habitus dominant in the Japan demographic composition. Japan curves and proportions in adult AI imagery should preserve the regional skeletal frame (height, shoulder-to-hip ratio, limb proportions) rather than scaling to a Western-European mesomorph default. The Japan nude female form, when rendered with anatomical fidelity, shows the height range, frame width, and adipose distribution pattern typical of the East Asian Sinitic / Mongoloid phenotype. Generic AI image generators tend to collapse regional body types into a few default shapes; the Ethnic Erotic phenotype-anchored approach preserves the Japan build as its own reference category.
Japan People: Skin Tone & Hair Texture
Japan skin tone falls in the light to medium (Fitzpatrick II-IV) band, the surface signal most often miscalibrated by generic AI nude generators trained on Western-photographic datasets. Japan hair texture is typically straight 1A, fine-to-medium, predominantly black, characteristic of the East Asian Sinitic / Mongoloid phenotype. For anatomically-accurate Japan nude renders the skin should hold the Fitzpatrick band consistently across body surface rather than showing the lighter-than-face body shading that AI generators default to. Japan hair pigmentation and texture on body, pubic, and head should match across the figure rather than mixing textures (a common AI artefact).
A descriptive view, not a claim about individuals
This page shows a weighted aggregate of phenotype observations across the Japan population, based on demographic composition from published census and ancestry sources. Phenotypes within any country are far more varied than the aggregate suggests; this is a descriptive reference, not a deterministic claim about any individual. For source-level detail on individual ethnic groups, see the constituent atlas pages linked below.
Japan in the History of Erotic Depiction
Manuals, literature & art traditions of this country · full timeline →
Shijūhatte (the Forty-Eight Techniques)
manualJapanese (Edo period) · 17th–19th century CE
The canonical 48 named positions of Edo Japan, styled after sumo technique names and depicted throughout shunga art; modern Japanese vernacular (e.g. ekiben) continues the naming tradition.
Shunga woodblock prints
artJapanese (Edo period) · 17th–19th century CE
Edo Japan's woodblock erotica — printed by the same masters as the ukiyo-e landscape canon — depicts the 48 techniques in vivid detail and made compositions like the interleaved matsuba famous far beyond Japan.
- Hokusai, "Tako to Ama" ("The Dream of the Fisherman's Wife"), British Museum, London
- Utamaro, Utamakura ("Poem of the Pillow"), British Museum & V&A (E.104-1954)
- Torii Kiyonaga, Sode no Maki ("Handscroll for the Sleeve"), MFA Boston & British Museumstanding face to face
- Moronobu, "Two Lovers" & "Courtesan with a Young Man beside a Screen", Metropolitan Museum of Art (JP676)face off
- + 3 more on the timeline
Methodology Notes
Composition weights are derived from the Statistics Bureau of Japan 2020 Population Census (令和2年国勢調査) cross-referenced with Ministry of Health, Labour and Welfare demographic data plus ethnographic and advocacy-organization estimates for ethnic sub-populations not enumerated by census (Ainu, Burakumin, Ryukyuan as distinct from Yamato Japanese, Korean-descended naturalized Japanese). Japan does not enumerate ethnicity in census instruments — only nationality — making the Yamato Japanese / Ryukyuan / Ainu / Burakumin distinctions methodologically more approximate than census-based enumerations elsewhere. Genome-wide ancestry context (Cooke et al. 2021, Watanabe et al. 2019, Jinam et al. 2012) supports phenotype interpretation. Caveats: (1) the Yamato umbrella aggregates substantial east-vs-west and north-vs-south regional sub-populations with detectable Jōmon-Yayoi ancestry differentiation; (2) the Ainu and broader Ainu-descended populations are substantially undercounted in the 13,000+ self-identification figure due to historical discrimination — the broader Ainu-descended population is estimated at 100,000+ but most individuals do not self-identify; (3) the Burakumin enumeration is included for historical-social reasons despite the population being phenotypically indistinguishable from broader Yamato Japanese; (4) the Ryukyuan-vs-Yamato distinction has been institutionally suppressed since the late-19th c. annexation of the Ryūkyū Kingdom — many Ryukyuan-descended individuals identify primarily as Japanese in census instruments, making the 1.1% share an estimate of cultural-linguistic rather than nationality self-identification.
Primary Sources
- 1.Statistics Bureau of Japan. 2020 Population Census of Japan (令和2年国勢調査). Tokyo: SBJ; 2021.
- 2.Cooke NP, Mattiangeli V, Cassidy LM, et al. Ancient genomics reveals tripartite origins of Japanese populations. Sci Adv. 2021;7(38):eabh2419. doi:10.1126/sciadv.abh2419
- 3.Jinam T, Nishida N, Hirai M, et al. The history of human populations in the Japanese Archipelago inferred from genome-wide SNP data. J Hum Genet. 2012;57(12):787-795. doi:10.1038/jhg.2012.114
- 4.Hokkaido Government. 2017 Hokkaido Ainu Living Conditions Survey. Sapporo: Hokkaido Government; 2017.
- 5.Lie J. Multiethnic Japan. Cambridge: Harvard University Press; 2001.
Other countries in East Asia
Aggregate phenotype references for neighbouring East Asia nations, weighted by demographic composition.