Help us get this right
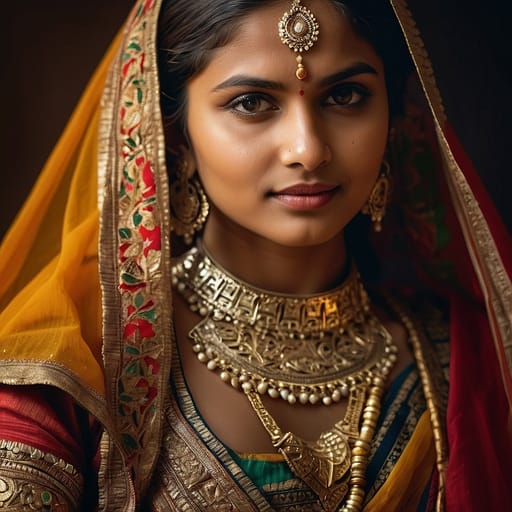
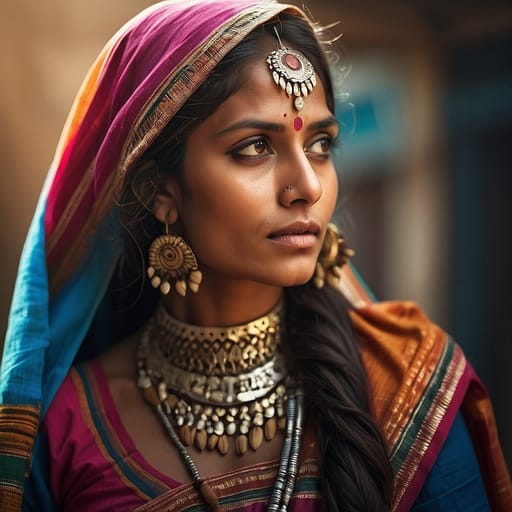
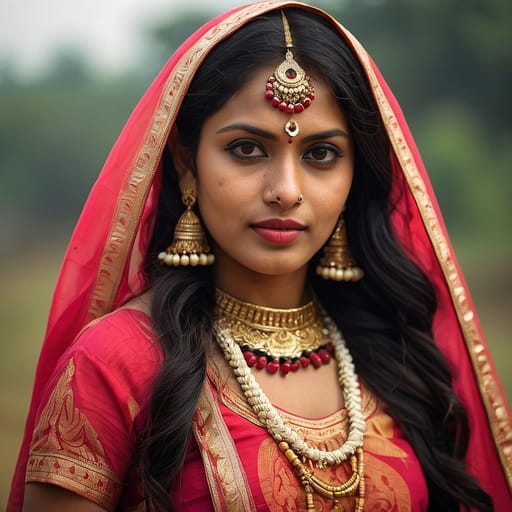
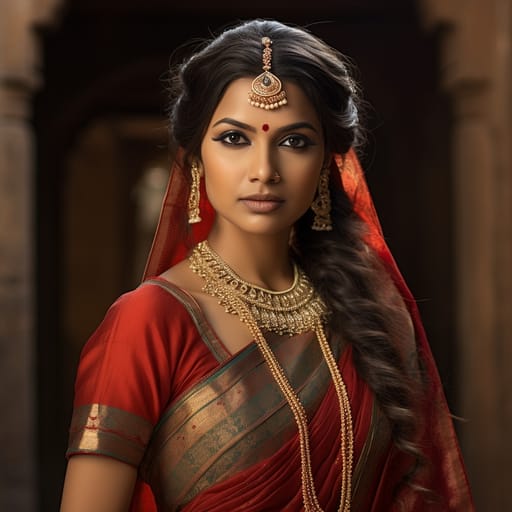
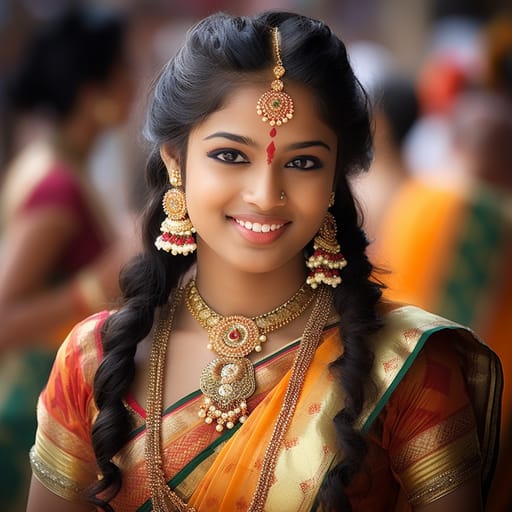
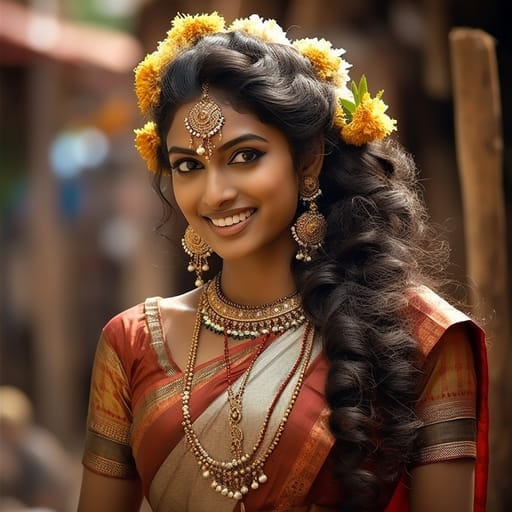
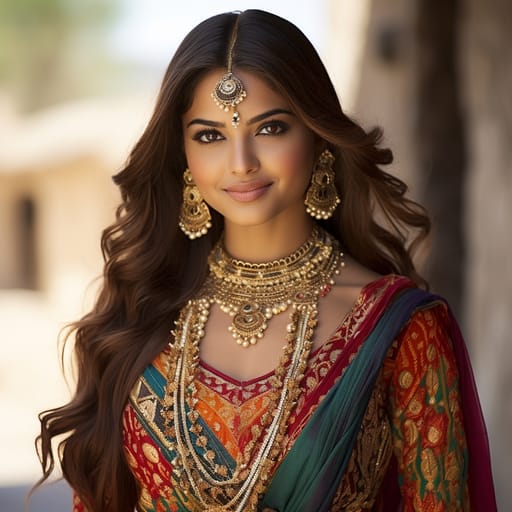
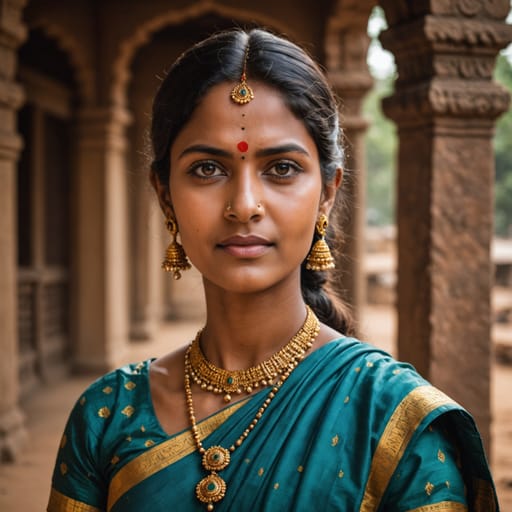
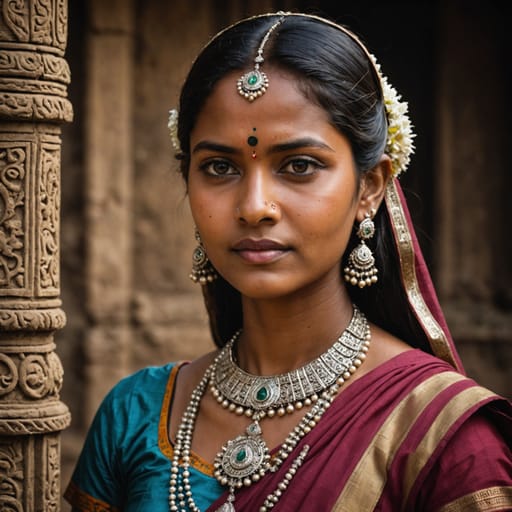
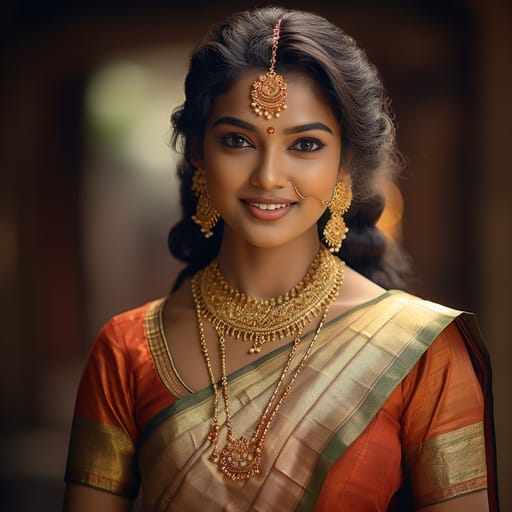
Does this portrait look right for Hindi Belt Indo-Aryan?
One tap. It takes a second and it is recorded.
1 says it looks right, 1 says it looks off.
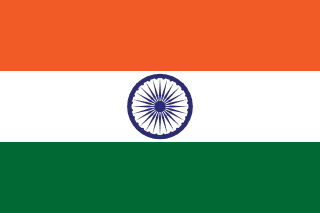

India
INSouth Asia
India is home to 15 documented ethnic groups in South Asia, led by Hindi Belt Indo-Aryan (~42%), Indian Tribal (~9%), Bengali Indian (~8%), Marathi (~7%). This page blends their phenotype and demographic data into one weighted reference: skin tone, facial features, hair texture and build, drawn from published census and ancestry sources.
Demographic Composition
Composition weights are derived from self-identification in published census and demographic surveys. Each row links to the source ethnic-group atlas page.
| Ethnic group | Weight | Source |
|---|---|---|
 Hindi Belt Indo-Aryan Hindi Belt Indo-Aryan | 42.0% | Office of the Registrar General & Census Commissioner of India 2011 Census plus Mother Tongue 2011 language data; Hindi-belt Indo-Aryan populations (predominantly Hindi, Urdu, Bhojpuri, Awadhi, Maithili, Magahi, Bundeli, Chhattisgarhi, Haryanvi, Rajasthani-language sub-populations of Uttar Pradesh, Bihar, Madhya Pradesh, Rajasthan, Haryana, Delhi, Uttarakhand, Himachal Pradesh, Jharkhand, Chhattisgarh) comprise approximately 42% of the Indian population, by far the largest umbrella sub-population. The 2011 Census enumerates Mother Tongue rather than ethnicity, and the Hindi-belt Indo-Aryan umbrella aggregates approximately 580+ million speakers across closely-related languages and dialects |
 Indian Tribal Indian Tribal | 8.7% | India 2011 Census, Scheduled Tribes (~104M, ~8.6% of population); the umbrella for India's approximately 700+ Scheduled Tribes (Adivasi / 'original inhabitants') ranging from the demographically substantial Gond, Bhil, Santhal, Mina, Oraon, Munda, Khond, and various Northeastern peoples (Naga, Mizo, Khasi, Garo, Bodo, Kuki, etc.) to the very small Andamanese island peoples (Great Andamanese, Onge, Jarawa, Sentinelese — the Sentinelese are the only contemporary Indian population in voluntary isolation) |
 Bengali Indian Bengali Indian | 8.0% | India 2011 Census, Bengali Mother Tongue speakers (~97M); concentrated in West Bengal, Tripura, parts of Assam (the Barak Valley), and the urban diaspora in major Indian metropolitan areas. Cross-border population shared with Bangladesh |
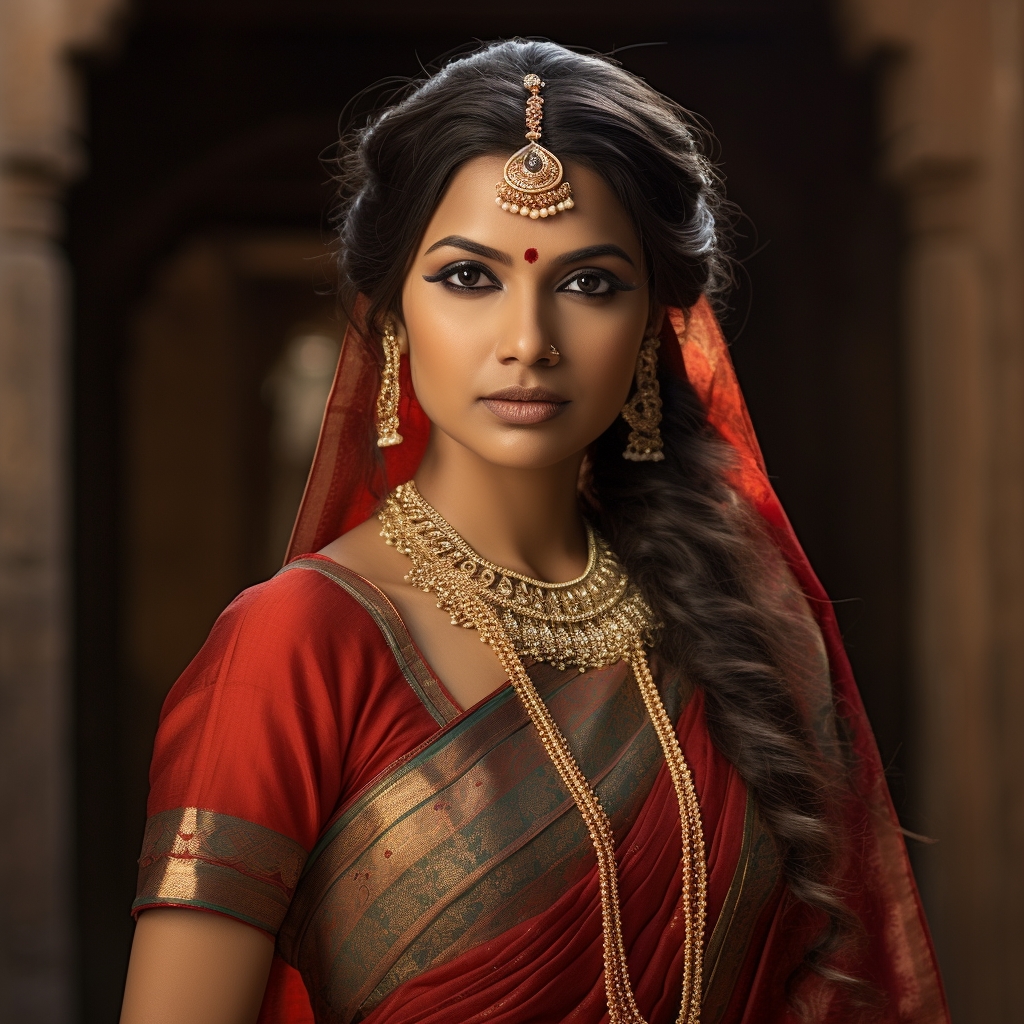 Marathi Marathi | 6.7% | India 2011 Census, Marathi Mother Tongue speakers (~83M); concentrated in Maharashtra plus diaspora communities in major Indian cities |
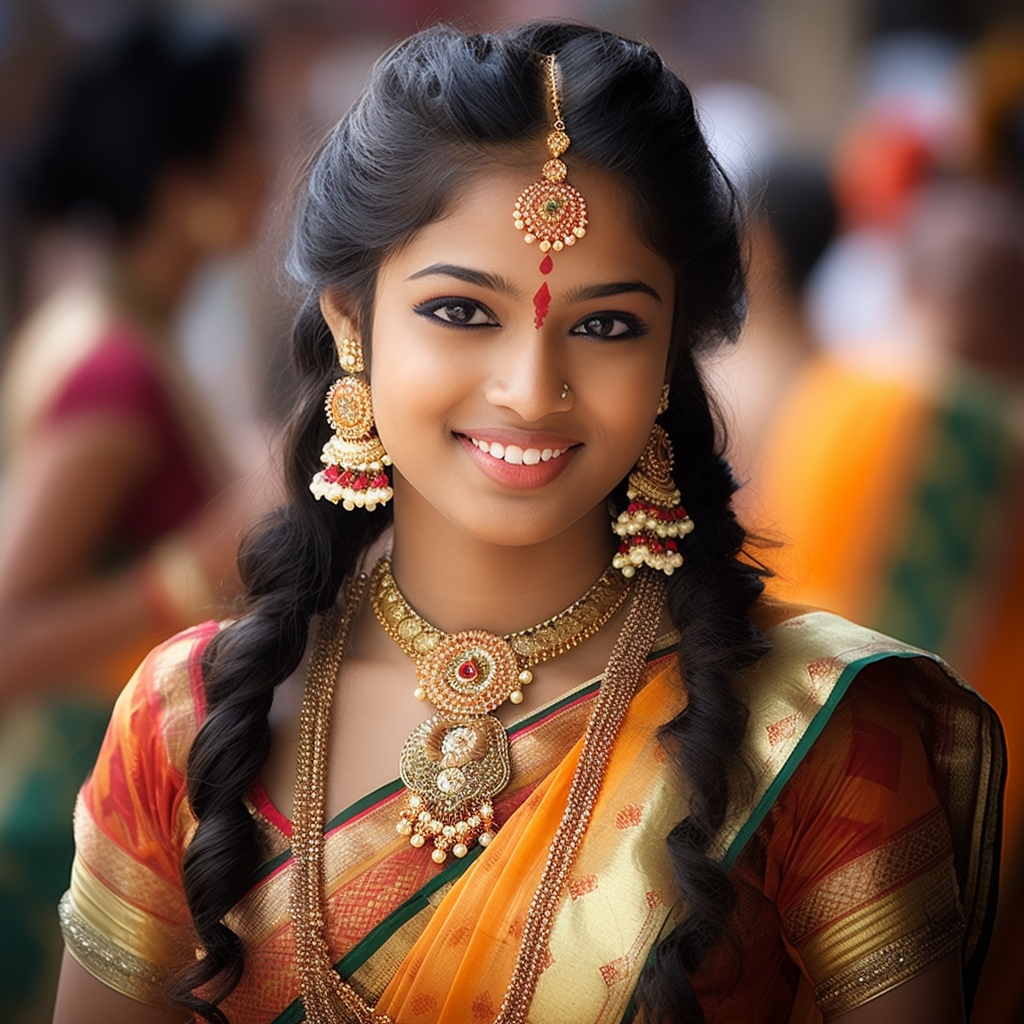 Telugu Telugu | 6.7% | India 2011 Census, Telugu Mother Tongue speakers (~81M); concentrated in Andhra Pradesh and Telangana plus diaspora communities |
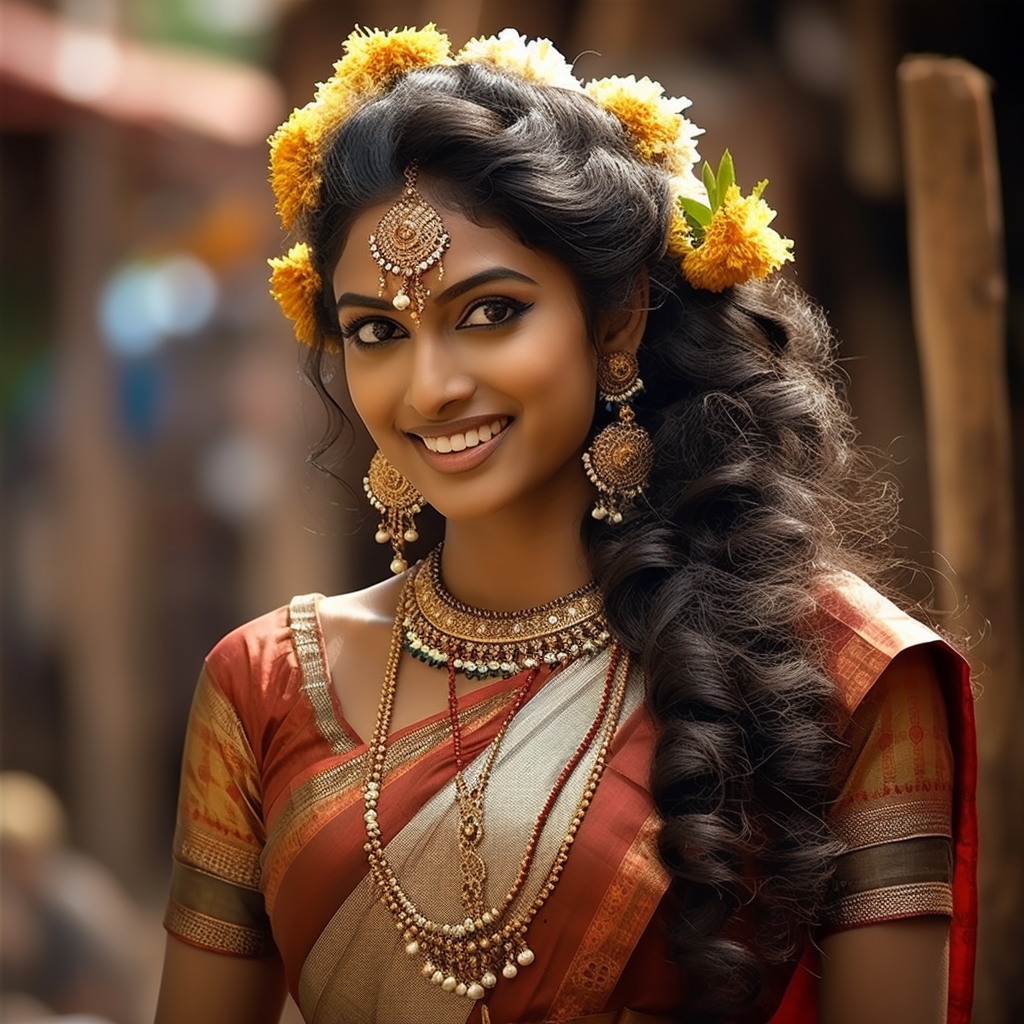 Tamil Tamil | 5.8% | India 2011 Census, Tamil Mother Tongue speakers (~69M in India); concentrated in Tamil Nadu and Puducherry plus diaspora communities. Cross-border population shared with Sri Lanka, Singapore, Malaysia, and the global Tamil diaspora |
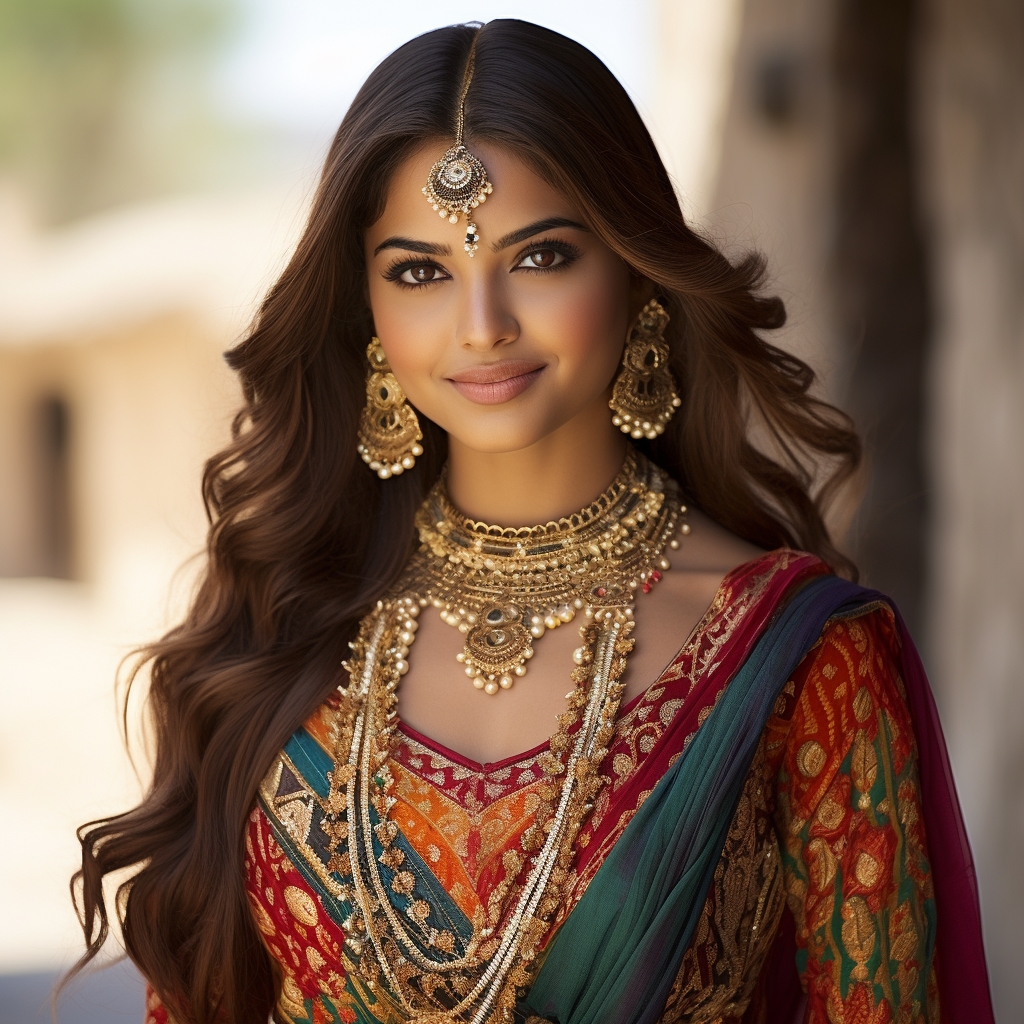 Gujarati Gujarati | 4.6% | India 2011 Census, Gujarati Mother Tongue speakers (~56M); concentrated in Gujarat plus the substantial global Gujarati diaspora (East Africa historically, the United Kingdom, the United States, Canada, the Caribbean — among the most globally dispersed South Asian sub-populations) |
 Kannada Indian Kannada Indian | 3.7% | India 2011 Census, Kannada Mother Tongue speakers (~44M); concentrated in Karnataka |
 Oriya Oriya | 3.2% | India 2011 Census, Odia Mother Tongue speakers (~38M); concentrated in Odisha |
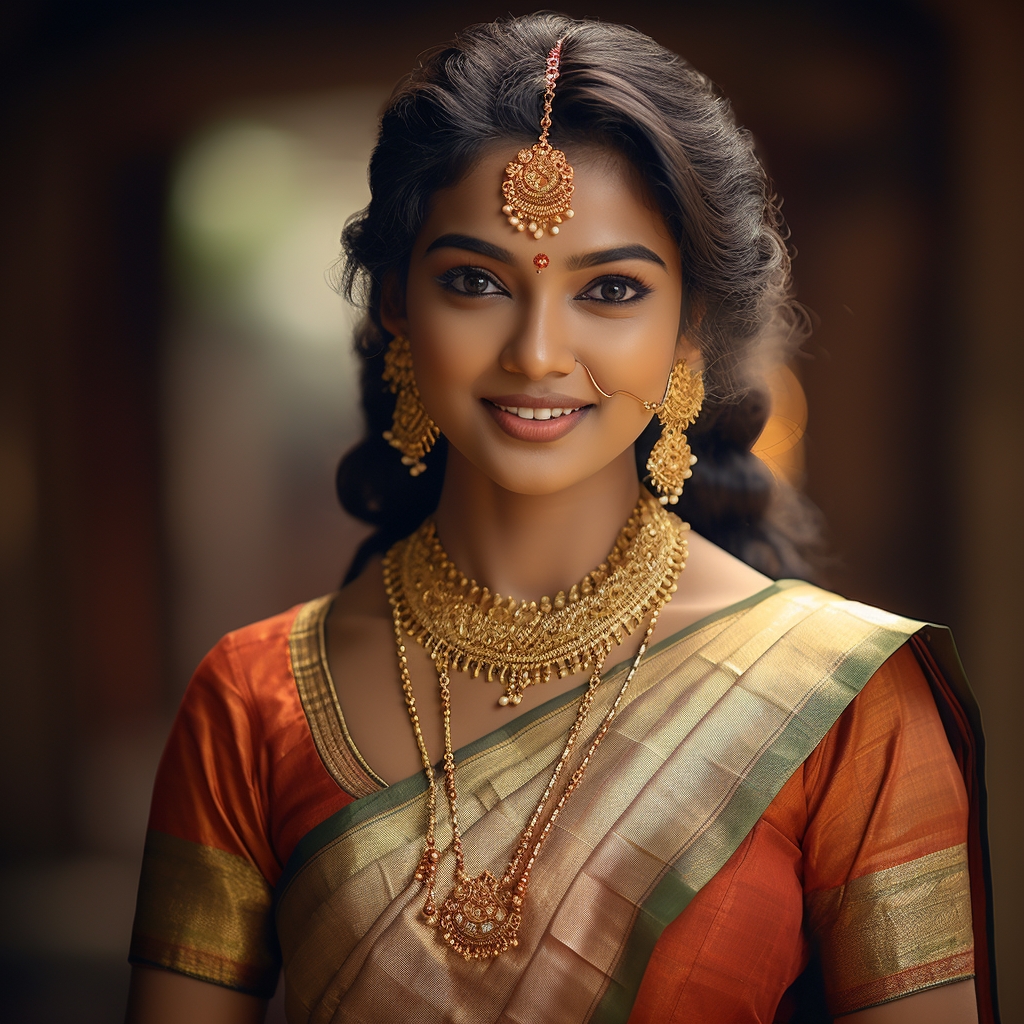 Malayali Malayali | 2.9% | India 2011 Census, Malayalam Mother Tongue speakers (~35M); concentrated in Kerala plus the substantial global Malayali diaspora (the Gulf Cooperation Council states, the United States, Australia) |
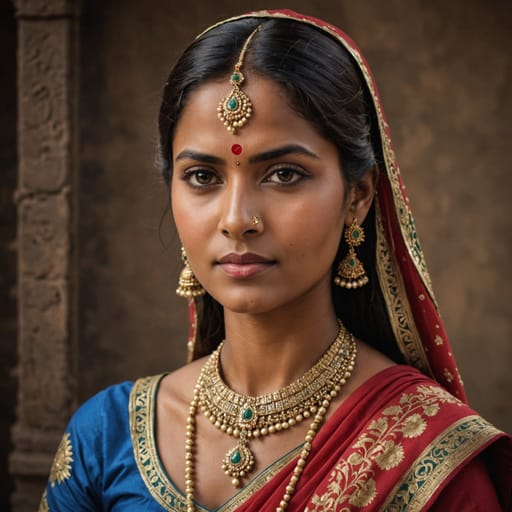 Indo Other Indo Other | 2.9% | India 2011 Census residual, includes other Indo-Aryan and smaller Mother Tongue speakers — Sindhi, Konkani, Manipuri, Bodo, Dogri, Sanskrit (recognized as a Scheduled Language though primarily liturgical/scholarly), plus the Anglo-Indian community, Parsi (Zoroastrian) community, and Indian Jewish (Bene Israel, Cochin Jews, Baghdadi Jews) communities |
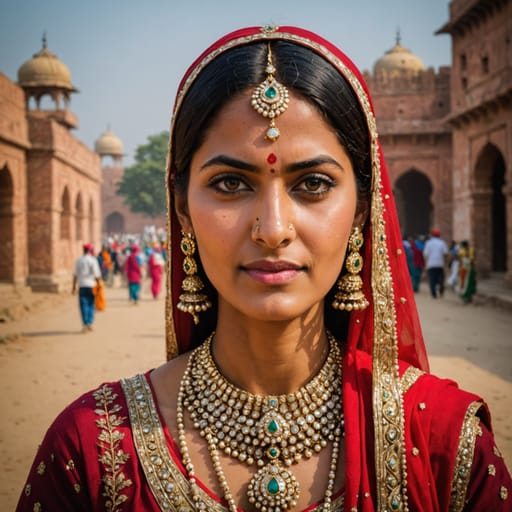 Punjabi Indian Punjabi Indian | 2.7% | India 2011 Census, Punjabi Mother Tongue speakers (~33M in India); concentrated in Punjab, Haryana, Delhi plus the substantial global Punjabi diaspora (Canada, the United Kingdom, the United States, Italy). Cross-border population shared with Pakistan |
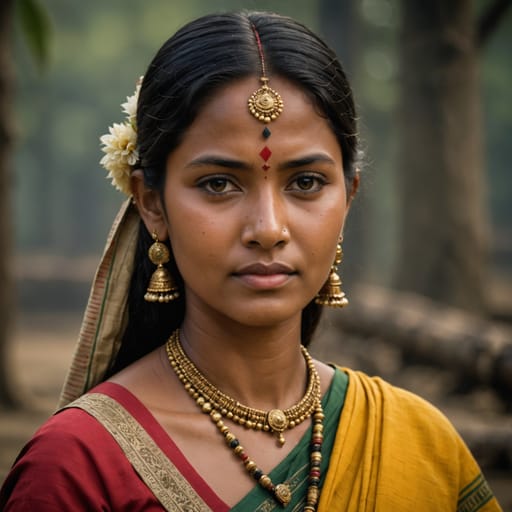 Assamese Assamese | 1.3% | India 2011 Census, Assamese Mother Tongue speakers (~15M); concentrated in Assam |
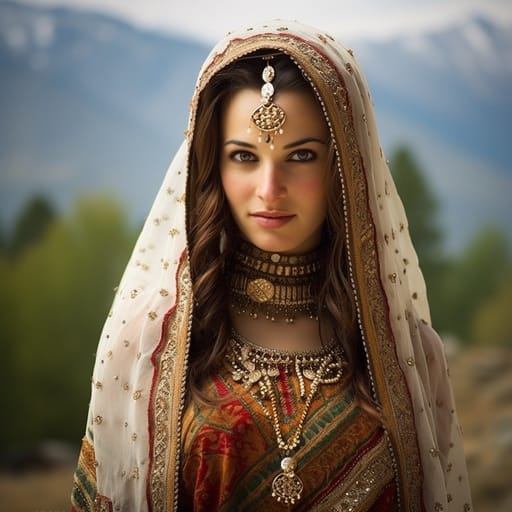 Kashmiri Kashmiri | 0.5% | India 2011 Census, Kashmiri Mother Tongue speakers (~7M); concentrated in Jammu and Kashmir region. Cross-border population in Pakistan-administered Kashmir |
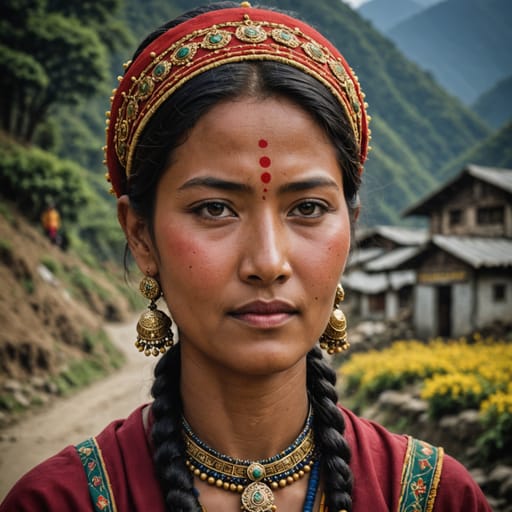 Nepali Indian Nepali Indian | 0.3% | India 2011 Census, Nepali Mother Tongue speakers in India (~3M); concentrated in Sikkim, Darjeeling district of West Bengal, and other Himalayan border regions |
Measured in portraits
Per-group trait distributions from documented photographs
India Phenotype Profile
India's population is among the most internally diverse national populations in the world — approximately 1.4 billion people across approximately 22 Scheduled Languages, ~700 Scheduled Tribes, multiple religious traditions (Hindu ~80%, Muslim ~14%, Christian ~2.3%, Sikh ~1.7%, Buddhist ~0.7%, Jain ~0.4%, plus smaller traditions), and substantial regional, caste-based, and rural-urban variation. The 2011 Census enumerates Mother Tongue rather than ethnicity directly; the composition above approximates ethnic-linguistic distribution from Mother Tongue data. The major Indo-Aryan populations (Hindi-belt ~42%, Bengali ~8%, Marathi ~7%, Gujarati ~5%, Punjabi ~3%, Odia ~3%, Assamese ~1%, plus smaller groups) are concentrated in the northern, western, and eastern regions. The major Dravidian populations (Telugu ~7%, Tamil ~6%, Kannada ~4%, Malayali ~3%) are concentrated in the southern peninsula. The Scheduled Tribes (~9%) are distributed across the central tribal belt, the Northeast, and smaller pockets including the Andaman Islands.
Genome-wide studies (Reich et al. 2009 'Reconstructing Indian Population History', Moorjani et al. 2013, Narasimhan et al. 2019) document Indian populations as showing substantial admixture between two foundational ancestry components — Ancestral North Indian (ANI, related to Steppe-pastoralist populations and broader West Eurasian source populations) and Ancestral South Indian (ASI, related to Andamanese-and-broader-pre-Holocene-South-Asian source populations) — with the ANI/ASI ratio varying systematically by geographic and caste position. Northern, northwestern, and higher-caste populations show higher ANI (~50-70%); southern, eastern, and Scheduled Tribe populations show higher ASI (~60-90%). The Northeast Indian Tibeto-Burman populations carry East Asian ancestry distinct from both ANI and ASI components.
Skin tone across the population spans the full Fitzpatrick range II-VI with IV-V the modal value nationally. The northwestern populations (Punjabi, Kashmiri, northern Hindi-belt, Pashtun-adjacent) skew lighter (II-IV); the southern Dravidian populations (Tamil, Telugu, Malayali, Kannada) skew darker (IV-V); the Northeast Indian Tibeto-Burman populations show distinct East Asian source-population features (Fitzpatrick III-IV with epicanthic-fold variants common); and the Andamanese island peoples show distinct phenotype features related to Southeast Asian / Negrito source populations. Hair texture is predominantly straight to wavy (Andre Walker 1A-2C) across most populations with some curly textures (3A-3B) in southern Dravidian and tribal populations. Hair color is uniformly black to very dark brown across most populations with some medium brown variants in northwestern populations. Eye color is predominantly brown to dark brown nationally, with elevated frequencies of hazel, green, and rarely blue variants in northwestern populations (Kashmiri, Punjabi, northern Hindi-belt). Facial features and build show similar regional patterning. Internal variance is exceptionally high; the country's regional and individual diversity is among the most extensive of any single national population.
India Body & Anatomy Reference
Per-feature anatomical profile for AI nude generation: Indo-Aryan / Dravidian South Asian phenotype dominant in India
India Women: Boobs & Breasts
India women's tits and boobs reflect the medium-to-large cup, moderate-to-full projection Indo-Aryan / Dravidian South Asian bust profile dominant in the India demographic composition. India nipples and areolas show medium-brown to dark-brown areolar pigmentation against the wheatish-to-brown skin tone, with areolar diameter typically in the 32-46mm range, distinct from the the smaller East Asian bust profile. India breast morphology trends full and soft, generally fuller than the East Asian norm, a function of the endomorph-to-mesomorph with fuller hip deposition body habitus and mean adult female BMI 22-25. For anatomically-accurate AI-generated India nude women the render should preserve: medium-to-large cup, moderate-to-full projection shape, 32-46mm areolas with regional pigmentation, and the torso proportions of the Indo-Aryan / Dravidian South Asian phenotype.
India Women: Ass & Hips
India women's ass and hip morphology presents as medium-to-full, moderate-to-high projection, classic curvy hip profile, distinctly different from the slim hip profile of East Asian women. India pelvic profile shows medium-to-wide iliac crests, full gluteal-femoral fat distribution, anchored in the Indo-Aryan / Dravidian South Asian skeletal pattern that dominates the India ethnic composition. India butt shots in adult AI imagery should render the medium-to-full, moderate-to-high projection, classic curvy hip profile silhouette with the endomorph-to-mesomorph with fuller hip deposition build and the gluteal-femoral fat distribution typical of the Indo-Aryan / Dravidian South Asian phenotype rather than defaulting to a globally-averaged shape that generic AI generators produce.
India Women: Vagina & Pussy
India women's pussy and vulvar anatomy presents medium-brown to dark-brown labial pigmentation, fuller labia minora projection, consistent with the Indo-Aryan / Dravidian South Asian phenotype's pigmentation pattern dominant in India. India pubic hair is typically straight-to-wavy coarse texture, dense distribution, distributed in the inverted-triangle pattern with regional-typical density. AI-generated India nude imagery should preserve the medium-brown to dark-brown labial pigmentation and the straight-to-wavy coarse texture hair texture rather than defaulting to a Western-European pink-and-sparse template. For anatomically-accurate India pussy renders the labial pigmentation should match the surrounding wheatish to brown skin tone of the Indo-Aryan / Dravidian South Asian phenotype.
India Men: Dicks & Penis
India men's dick and penile anatomy in adult AI generation should anchor on the regional reference data: regional mean ~13cm erect, moderate girth, and medium-brown shaft pigmentation. India cock profile reflects the Indo-Aryan / Dravidian South Asian ancestral population's anthropometric measurements rather than a globally-averaged Western-pornography default. For anatomically-accurate India nude male imagery the shaft pigmentation should track the surrounding wheatish to brown skin tone, with continuous glans-to-shaft pigmentation transition and the straight-to-wavy coarse texture pubic-hair texture distributed in the typical inverted-V escutcheon. Circumcision status across India men varies by religious and cultural tradition rather than ancestral phenotype.
India People: Body, Curves & Build
India body type and overall build presents as endomorph-to-mesomorph with fuller hip deposition, with mean adult female BMI 22-25: the characteristic Indo-Aryan / Dravidian South Asian habitus dominant in the India demographic composition. India curves and proportions in adult AI imagery should preserve the regional skeletal frame (height, shoulder-to-hip ratio, limb proportions) rather than scaling to a Western-European mesomorph default. The India nude female form, when rendered with anatomical fidelity, shows the height range, frame width, and adipose distribution pattern typical of the Indo-Aryan / Dravidian South Asian phenotype. Generic AI image generators tend to collapse regional body types into a few default shapes; the Ethnic Erotic phenotype-anchored approach preserves the India build as its own reference category.
India People: Skin Tone & Hair Texture
India skin tone falls in the wheatish to brown (Fitzpatrick III-V) band, the surface signal most often miscalibrated by generic AI nude generators trained on Western-photographic datasets. India hair texture is typically straight-to-wavy 1A-2B, dense, dark-brown to black, characteristic of the Indo-Aryan / Dravidian South Asian phenotype. For anatomically-accurate India nude renders the skin should hold the Fitzpatrick band consistently across body surface rather than showing the lighter-than-face body shading that AI generators default to. India hair pigmentation and texture on body, pubic, and head should match across the figure rather than mixing textures (a common AI artefact).
A descriptive view, not a claim about individuals
This page shows a weighted aggregate of phenotype observations across the India population, based on demographic composition from published census and ancestry sources. Phenotypes within any country are far more varied than the aggregate suggests; this is a descriptive reference, not a deterministic claim about any individual. For source-level detail on individual ethnic groups, see the constituent atlas pages linked below.
India in the History of Erotic Depiction
Manuals, literature & art traditions of this country · full timeline →
Kama Sutra
manualIndian (Gupta era) · c. 3rd century CE
The most famous of the Sanskrit kama shastra texts; Book 2 catalogues embraces and congress positions with named forms (bandha).
Ananga Ranga
manualIndian (late medieval) · 15th–16th century CE
Late-medieval Indian manual organising positions into classes: uttana (supine), tiryak (side), upavishta (seated), utthita (standing), and vyanta (prone/rear).
Khajuraho & Konark temple sculpture
artIndian (medieval temple tradition) · c. 950–1250 CE
The maithuna panels of Khajuraho and the Konark Sun Temple carve the kama shastra tradition in stone — standing carries, raised-leg unions, and acrobatic group compositions on public temple walls.
- Kandariya Mahadeva Temple, erotic frieze, Khajuraho, Madhya Pradesh (UNESCO)
- Lakshmana Temple, maithuna niches and plinth frieze, Khajuraho
- Vishvanatha Temple, erotic relief group, Khajuraho
- Konark Sun Temple, jagamohana exterior mithuna bands, Konark, Odisha (UNESCO)
- + 2 more on the timeline
Persian & Mughal erotic miniatures
artPersian & Mughal · 16th–19th century CE
Court albums from Persia and Mughal India set couples on carpets and cushions — seated embraces and reclined, legs-raised unions painted with the same refinement as any court portrait.
- Untitled miniature, "lady reclining against a cushion," attrib. 'Abdullah Bukhari, Sold Sotheby's, 2012, lot 224; now private collection
- Two erotic scenes, attrib. 'Abdullah Bukhari, Ex-Soustiel collection; sold Sotheby's, 2017, lot 55
- Ottoman erotic manuscript — "Tuhfet ül-Mülk" ("The Kings' Gift"), The David Collection, Copenhagen (8/2018)
- Three Qajar erotic miniatures, signed by Lutf'ali, Sold Bonhams, 2015, lot 145; private collection
- + 3 more on the timeline
Methodology Notes
Composition weights are derived from the Office of the Registrar General & Census Commissioner of India 2011 Census, the most recent comprehensive Indian census (the planned 2021 census was delayed by the COVID-19 pandemic and political reasons; a 2025-2026 census is in process but has not yet produced public microdata). The 2011 Census enumerates Mother Tongue rather than ethnicity directly — the composition above approximates ethnic-linguistic distribution from Mother Tongue data, supplemented by Scheduled Tribe enumeration. Genome-wide ancestry context (Reich et al. 2009, Moorjani et al. 2013, Narasimhan et al. 2019) supports phenotype interpretation. Caveats: (1) the composition aggregates Indo-Aryan languages of the Hindi belt into a single umbrella that obscures substantial regional and caste-based phenotype variation; (2) the Dravidian languages are enumerated separately but the Tamil-Telugu-Kannada-Malayalam phenotype distinctions are subtle and contested; (3) the 700+ Scheduled Tribes are a single umbrella that aggregates extraordinarily heterogeneous populations across multiple language families and source populations — specific groups should be referenced via dedicated atlas pages where available; (4) the caste-based variation within each language-group umbrella is substantial and is not separately enumerated in the composition; (5) the substantial Indian diaspora globally (~32M+ NRIs and PIOs across the United States, the Gulf states, the United Kingdom, Canada, Australia, the Caribbean, East Africa, Southeast Asia, etc.) is not captured in source-country composition; (6) the Indian-Muslim community is the largest single national Muslim population outside Indonesia and Pakistan but is enumerated by Mother Tongue (most Indian Muslims speak Hindi-Urdu, Bengali, or other regional languages) rather than separately as a religious community in this composition.
Primary Sources
- 1.Office of the Registrar General & Census Commissioner of India. Census of India 2011: General Report. New Delhi: ORGI; 2014.
- 2.Reich D, Thangaraj K, Patterson N, et al. Reconstructing Indian population history. Nature. 2009;461(7263):489-494. doi:10.1038/nature08365
- 3.Moorjani P, Thangaraj K, Patterson N, et al. Genetic evidence for recent population mixture in India. Am J Hum Genet. 2013;93(3):422-438. doi:10.1016/j.ajhg.2013.07.006
- 4.Narasimhan VM, Patterson N, Moorjani P, et al. The formation of human populations in South and Central Asia. Science. 2019;365(6457):eaat7487. doi:10.1126/science.aat7487
- 5.Reich D. Who We Are and How We Got Here: Ancient DNA and the New Science of the Human Past. New York: Pantheon; 2018.
Other countries in South Asia
Aggregate phenotype references for neighbouring South Asia nations, weighted by demographic composition.