Help us get this right
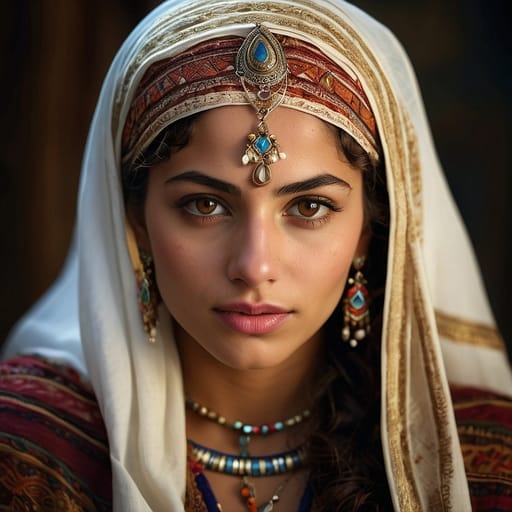
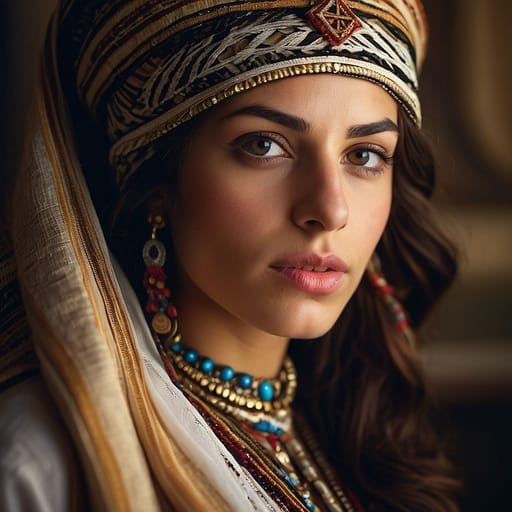
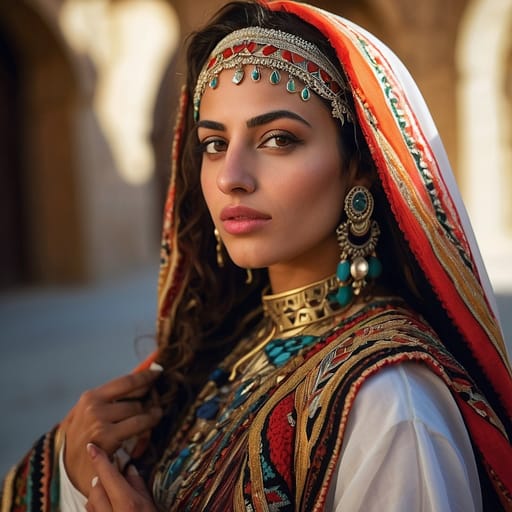
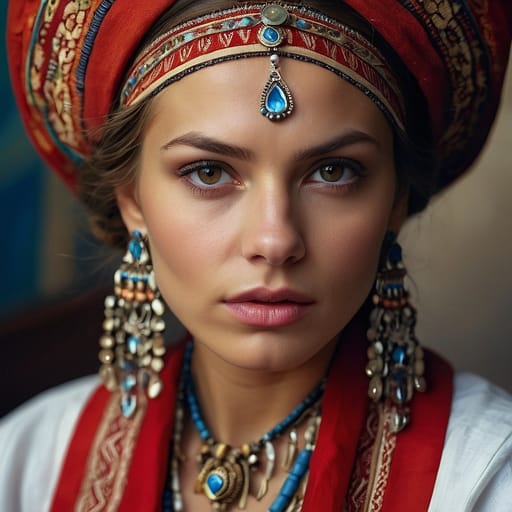
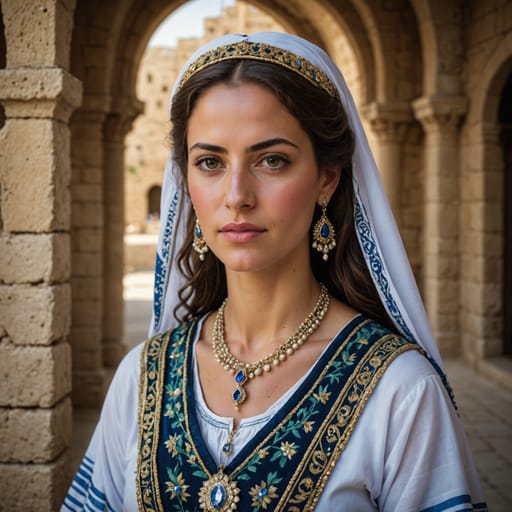
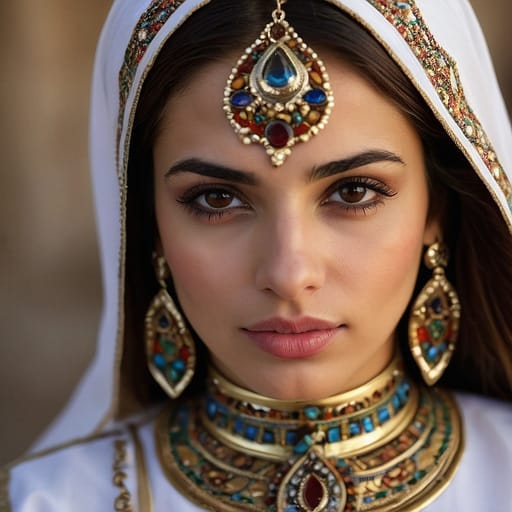
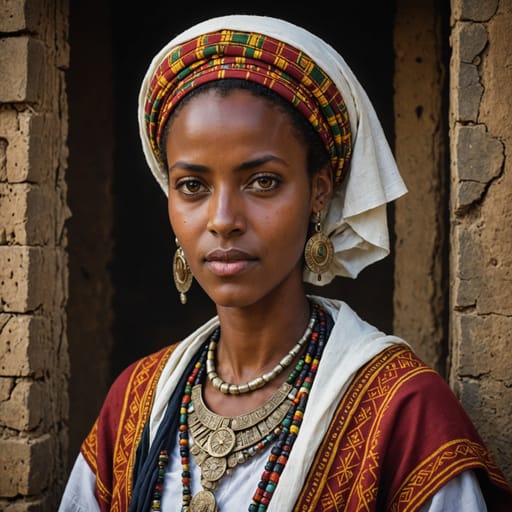
Does this portrait look right for Mizrahi Jewish?
One tap. It takes a second and it is recorded.
1 says it looks right, 0 say it looks off.

Israel
ILWestern Asia
Israel is home to 7 documented ethnic groups in Western Asia, led by Mizrahi Jewish (~33%), Ashkenazi Jewish (~30%), Israeli Arab (~18%), Russian Israeli (~9%). This page blends their phenotype and demographic data into one weighted reference: skin tone, facial features, hair texture and build, drawn from published census and ancestry sources.
Demographic Composition
Composition weights are derived from self-identification in published census and demographic surveys. Each row links to the source ethnic-group atlas page.
| Ethnic group | Weight | Source |
|---|---|---|
 Mizrahi Jewish Mizrahi Jewish | 33.0% | Israel CBS 2023 estimates; Mizrahi / Sephardic Jews (~33%, ~3.0M+); descendants of Jewish populations from the broader Middle East and North Africa (Iraqi, Iranian, Yemeni, Moroccan, Tunisian, Algerian, Libyan, Egyptian, Syrian, Lebanese, Turkish, Bulgarian, Greek, plus other source communities). The post-1948 expulsions and emigration of Jewish populations from Arab countries (~800,000-1M+) produced substantial Mizrahi-Jewish migration to Israel |
 Ashkenazi Jewish Ashkenazi Jewish | 30.0% | Israel Central Bureau of Statistics 2023 demographic estimates plus academic research; Ashkenazi Jews (~30%, ~2.8M+); descendants of European Jewish populations (predominantly Eastern European, Russian, Polish, German, plus other source countries). The post-1933 Nazi-era and post-1948 emigration produced substantial Ashkenazi-Jewish migration to Mandatory Palestine and the post-1948 State of Israel |
 Israeli Arab Israeli Arab | 18.0% | Israel CBS 2023 estimates; Israeli Arabs (Palestinian citizens of Israel) (~18%, ~1.7M+); the descendants of the Palestinian Arab population that remained within the post-1948 Israeli state borders (the so-called '48 Arabs' or 'Arab citizens of Israel'). Concentrated in the Galilee, the Triangle (central Israel), the Negev (Bedouin Arab communities), plus the urban centers of Haifa, Akko, Jaffa, Lod, Ramla, and East Jerusalem (East Jerusalem residents are predominantly Israeli-permanent-residents not citizens) |
 Russian Israeli Russian Israeli | 9.0% | Israel CBS 2023 estimates; Russian-speaking Israelis (~9%, ~830,000+); the post-1989 Soviet Union collapse-era and continuing Russian-Jewish-and-Soviet-Jewish-descended emigration produced approximately 1M+ Russian-Israeli population. The Russian-Israeli community has been politically and culturally distinctive with substantial Russian-language cultural production and political mobilization |
 Israel Other Israel Other | 6.0% | Israel CBS 2023 residual; includes Israeli Christians (Christian Arabs ~178,000+ included in Israeli-Arab; Russian-Israeli Christian, Eritrean and South-Sudanese refugee populations), foreign workers and asylum seekers (Filipino, Thai, Romanian, Sri Lankan, Indian, Eritrean, Sudanese, plus other source populations), Bahá'í Israelis (the Bahá'í World Centre is in Haifa with ~700+ resident Bahá'í), Israeli Circassians (~4,000+ in Kfar Kama and Reyhaniya, descendants of 19th-c. Circassian refugees from the Russian Caucasus), Israeli Samaritans (~400+ in Holon, the historic Samaritan religious community), plus other smaller groups |
 Druze Druze | 2.0% | Israel CBS 2023 estimates; Israeli Druze (~2%, ~150,000+); concentrated in the Galilee (Daliyat al-Karmel, Isfiya, Beit Jann, plus other communities) plus the Golan Heights (where the Druze community is predominantly Syrian-citizenship-holding). The Druze are a distinct ethno-religious community following the syncretic Druze religion (incorporating elements of Islamic, Gnostic, Neoplatonic, and other source-religious traditions). Cross-border populations in Lebanon (~280,000+), Syria (~700,000+), and Jordan (~32,000+) |
 Ethiopian Jewish Ethiopian Jewish | 2.0% | Israel CBS 2023 estimates; Ethiopian Jews / Beta Israel (~2%, ~170,000+); descendants of the Ethiopian Jewish community brought to Israel through Operation Moses (1984-1985) and Operation Solomon (1991) plus subsequent immigration. Jewish religious tradition with substantial cultural-distinctness from broader Israeli-Jewish communities |
Israel Phenotype Profile
Israel is a multi-ethnic state with a distinctive demographic structure: Jewish populations (~75% combined: Mizrahi/Sephardic ~33%, Ashkenazi ~30%, Russian-speaking ~9%, Ethiopian ~2%) plus Israeli Arab citizens (~18%, predominantly Palestinian-descended Sunni Muslim, Christian, plus Druze separately enumerated), Druze (~2%), and other smaller communities (~6%). The country was established in 1948 and has grown through substantial Jewish immigration (the post-1948 Israeli-Arab population of ~150,000+ has grown to ~1.7M+ through natural increase; the post-1948 Jewish population of ~600,000+ has grown to ~7M+ through both natural increase and substantial immigration, particularly the post-1989 Soviet immigration of ~1M+, the 1948-1972 emigration of ~800,000+ Jews from Arab countries, the 1984-1991 Ethiopian Jewish immigration of ~22,000+, plus continuing immigration).
Genome-wide studies place Israeli Jewish populations as showing substantial Levantine / Middle Eastern source-population ancestry across all sub-populations — Ashkenazi Jewish populations show ~50-60% Levantine plus ~40-50% European (predominantly Southern European / Italian) admixture; Mizrahi Jewish populations show predominantly Middle Eastern source-population ancestry from their respective Iraqi, Iranian, Yemeni, etc. source communities; Ethiopian Jewish populations show predominantly East African ancestry; Russian-speaking Israeli populations show predominantly Eastern European source-population ancestry; Israeli Arab populations show predominantly Levantine source-population ancestry. The Druze population shows characteristic Levantine source-population ancestry with substantial population-genetic distinctness from surrounding Arab populations through the endogamous marriage practice.
Skin tone across the population spans Fitzpatrick I-VI with III the modal value nationally — substantial regional and ethnic-group variation. Hair texture spans the full Andre Walker range from straight (predominantly Russian-speaking Israeli, broader Ashkenazi populations) to wavy and curly (broader Levantine Jewish-Arab-Druze populations, Mizrahi Jewish populations) to coily (Ethiopian Jewish populations). Hair color is predominantly black to dark brown across the broader population with non-trivial frequencies of lighter variants in Ashkenazi and Russian-speaking sub-populations. Eye color is predominantly brown with elevated frequencies of hazel, green, and blue variants in Ashkenazi, Russian-speaking, and some Druze sub-populations. Build varies; adult Israeli male mean stature is approximately 175-178 cm in 2010s-2020s urban cohorts.
Israel Body & Anatomy Reference
Per-feature anatomical profile for AI nude generation: Levantine / Mediterranean Middle Eastern phenotype dominant in Israel
Israel Women: Boobs & Breasts
Israel women's tits and boobs reflect the medium-to-large cup, full, moderate-to-high projection Levantine / Mediterranean Middle Eastern bust profile dominant in the Israel demographic composition. Israel nipples and areolas show medium-brown to dark-brown areolar pigmentation against the olive-to-light-brown skin tone, with areolar diameter typically in the 32-46mm range, distinct from the the smaller East Asian bust profile. Israel breast morphology trends full and soft, fuller projection than the North-African Berber norm, a function of the mesomorph with fuller hip-and-bust deposition body habitus and mean adult female BMI 25-28. For anatomically-accurate AI-generated Israel nude women the render should preserve: medium-to-large cup, full, moderate-to-high projection shape, 32-46mm areolas with regional pigmentation, and the torso proportions of the Levantine / Mediterranean Middle Eastern phenotype.
Israel Women: Ass & Hips
Israel women's ass and hip morphology presents as medium-to-full, moderate projection, broader hip profile, distinctly different from the slim East Asian narrow-hip profile. Israel pelvic profile shows medium-to-wide iliac crests, fuller gluteal-femoral deposition, anchored in the Levantine / Mediterranean Middle Eastern skeletal pattern that dominates the Israel ethnic composition. Israel butt shots in adult AI imagery should render the medium-to-full, moderate projection, broader hip profile silhouette with the mesomorph with fuller hip-and-bust deposition build and the gluteal-femoral fat distribution typical of the Levantine / Mediterranean Middle Eastern phenotype rather than defaulting to a globally-averaged shape that generic AI generators produce.
Israel Women: Vagina & Pussy
Israel women's pussy and vulvar anatomy presents medium-brown to dark-brown labial pigmentation, fuller labia minora, consistent with the Levantine / Mediterranean Middle Eastern phenotype's pigmentation pattern dominant in Israel. Israel pubic hair is typically wavy-to-coiled medium-coarse dark texture, dense distribution, distributed in the inverted-triangle pattern with regional-typical density. AI-generated Israel nude imagery should preserve the medium-brown to dark-brown labial pigmentation and the wavy-to-coiled medium-coarse dark texture hair texture rather than defaulting to a Western-European pink-and-sparse template. For anatomically-accurate Israel pussy renders the labial pigmentation should match the surrounding olive to medium-brown skin tone of the Levantine / Mediterranean Middle Eastern phenotype.
Israel Men: Dicks & Penis
Israel men's dick and penile anatomy in adult AI generation should anchor on the regional reference data: regional mean ~14cm erect, moderate-to-above-average girth, and medium-brown shaft pigmentation. Israel cock profile reflects the Levantine / Mediterranean Middle Eastern ancestral population's anthropometric measurements rather than a globally-averaged Western-pornography default. For anatomically-accurate Israel nude male imagery the shaft pigmentation should track the surrounding olive to medium-brown skin tone, with continuous glans-to-shaft pigmentation transition and the wavy-to-coiled medium-coarse dark texture pubic-hair texture distributed in the typical inverted-V escutcheon. Circumcision status across Israel men varies by religious and cultural tradition rather than ancestral phenotype.
Israel People: Body, Curves & Build
Israel body type and overall build presents as mesomorph with fuller hip-and-bust deposition, with mean adult female BMI 25-28: the characteristic Levantine / Mediterranean Middle Eastern habitus dominant in the Israel demographic composition. Israel curves and proportions in adult AI imagery should preserve the regional skeletal frame (height, shoulder-to-hip ratio, limb proportions) rather than scaling to a Western-European mesomorph default. The Israel nude female form, when rendered with anatomical fidelity, shows the height range, frame width, and adipose distribution pattern typical of the Levantine / Mediterranean Middle Eastern phenotype. Generic AI image generators tend to collapse regional body types into a few default shapes; the Ethnic Erotic phenotype-anchored approach preserves the Israel build as its own reference category.
Israel People: Skin Tone & Hair Texture
Israel skin tone falls in the olive to medium-brown (Fitzpatrick III-V) band, the surface signal most often miscalibrated by generic AI nude generators trained on Western-photographic datasets. Israel hair texture is typically wavy-to-curly 2B-3B, predominantly dark-brown to black, characteristic of the Levantine / Mediterranean Middle Eastern phenotype. For anatomically-accurate Israel nude renders the skin should hold the Fitzpatrick band consistently across body surface rather than showing the lighter-than-face body shading that AI generators default to. Israel hair pigmentation and texture on body, pubic, and head should match across the figure rather than mixing textures (a common AI artefact).
A descriptive view, not a claim about individuals
This page shows a weighted aggregate of phenotype observations across the Israel population, based on demographic composition from published census and ancestry sources. Phenotypes within any country are far more varied than the aggregate suggests; this is a descriptive reference, not a deterministic claim about any individual. For source-level detail on individual ethnic groups, see the constituent atlas pages linked below.
Methodology Notes
Composition weights are derived from Israel Central Bureau of Statistics 2023 demographic estimates plus academic research. Israel does not enumerate ethnicity directly in census instruments — Israeli census data covers nationality, religion, and demographic characteristics. The Jewish-vs-Arab distinction is the primary census category; Jewish sub-populations (Ashkenazi, Mizrahi, Sephardic, Ethiopian, Russian) are enumerated through self-reported origin (the 'country of origin' variable). Caveats: (1) the Mizrahi / Sephardic distinction is contested in academic and Israeli-political discourse — the strict definitions distinguish Mizrahi (non-European Middle Eastern and North African Jews) from Sephardic (Iberian-Peninsula-derived Jewish populations and their post-1492 diaspora) but the popular usage often conflates the two; (2) the post-2007 Israeli Bedouin demographic-political situation has been particularly contested with documented forced-resettlement programs; (3) the East Jerusalem Palestinian population (approximately 350,000+) has predominantly permanent-resident rather than citizen status and is enumerated separately from the broader Israeli-Arab citizen population; (4) the substantial post-1948 Palestinian refugee diaspora is not captured in Israeli demographic enumeration; (5) the post-2023 Israel-Hamas war and broader regional disruption has affected demographic-data collection.
Primary Sources
- 1.Central Bureau of Statistics Israel. Statistical Abstract of Israel 2023. Jerusalem: CBS; 2023.
- 2.Ostrer H. Legacy: A Genetic History of the Jewish People. Oxford University Press; 2012.
- 3.Behar DM, Yunusbayev B, Metspalu M, et al. The genome-wide structure of the Jewish people. Nature. 2010;466(7303):238-242.
- 4.Sand S. The Invention of the Jewish People (translated). Verso; 2009.
- 5.Smooha S. The Index of Arab-Jewish Relations in Israel. University of Haifa; 2012.
Other countries in Western Asia
Aggregate phenotype references for neighbouring Western Asia nations, weighted by demographic composition.