Help us get this right
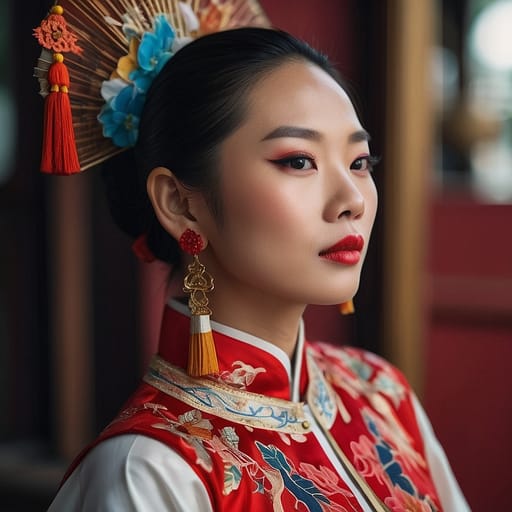
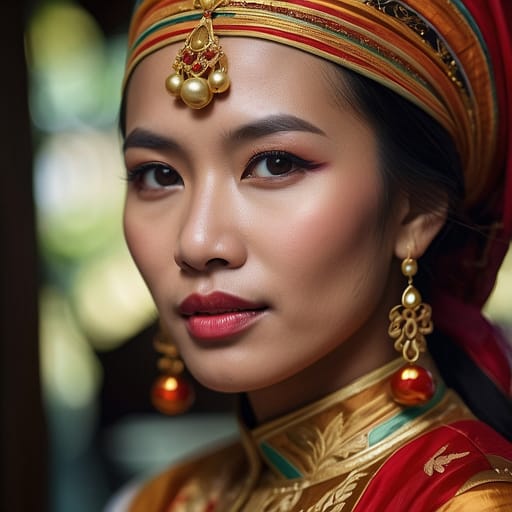
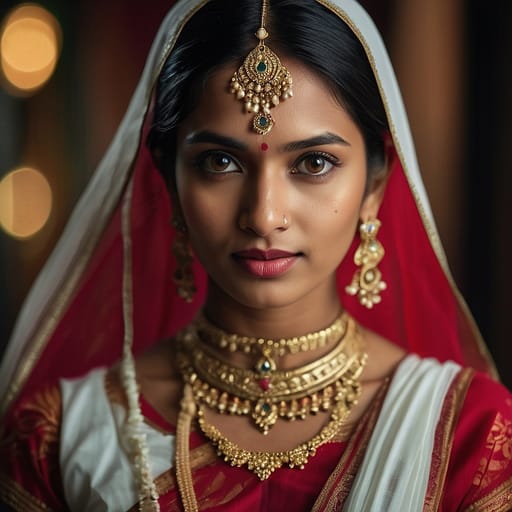
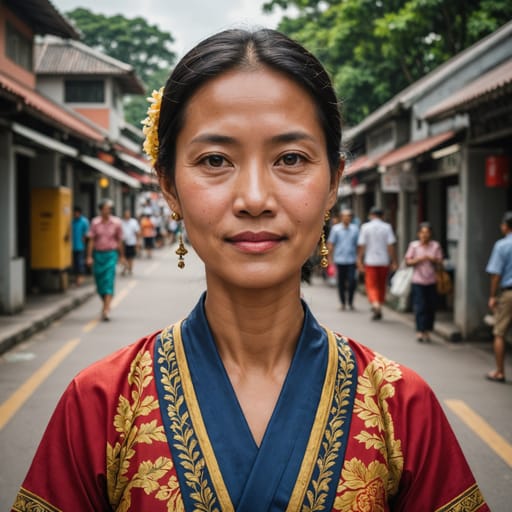
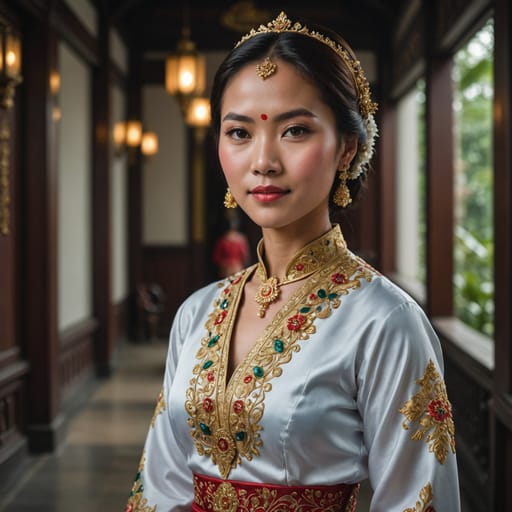
Does this portrait look right for Chinese Singaporean?
One tap. It takes a second and it is recorded.
1 says it looks right, 0 say it looks off.
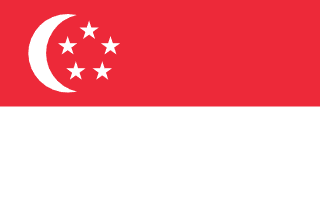

Singapore
SGSoutheast Asia
Singapore is home to 5 documented ethnic groups in Southeast Asia, led by Chinese Singaporean (~75%), Malay Singaporean (~14%), Indian Singaporean (~9%), Singapore Non Resident (~2%). This page blends their phenotype and demographic data into one weighted reference: skin tone, facial features, hair texture and build, drawn from published census and ancestry sources.
Demographic Composition
Composition weights are derived from self-identification in published census and demographic surveys. Each row links to the source ethnic-group atlas page.
| Ethnic group | Weight | Source |
|---|---|---|
 Chinese Singaporean Chinese Singaporean | 74.9% | Department of Statistics Singapore 2020 Census; self-identified Chinese (~74.9%, ~3.0M+ of ~4.0M citizen-and-resident population, before counting non-resident foreigners). The Chinese-Singaporean community is the dominant ethnic group, predominantly descended from 19th-c. and early-20th-c. immigration from southern China |
 Malay Singaporean Malay Singaporean | 13.5% | Singapore 2020 Census, self-identified Malay (~13.5%, ~540,000+); the second-largest ethnic group. Predominantly Sunni Muslim. Includes Indigenous Singaporean Malays plus broader Malay populations from neighboring Peninsular Malaysia and Indonesia |
 Indian Singaporean Indian Singaporean | 9.0% | Singapore 2020 Census, self-identified Indian (~9.0%, ~360,000+); descended from British-colonial-era and continuing immigration from India. Predominantly Tamil-source plus smaller Punjabi-Sikh, Bengali, Malayali, Telugu, Sindhi sub-populations |
 Singapore Non Resident Singapore Non Resident | 1.9% | Singapore 2020 Census non-resident foreign-population estimate; foreign workers and residents (~1.9% in this composition treating only the citizen-and-permanent-resident base; broader Singapore population including non-resident foreigners is ~5.8M, of which approximately 1.6M are non-resident foreigners predominantly from Malaysia, China, India, Bangladesh, the Philippines, Indonesia, Myanmar). The composition above uses the citizen-and-permanent-resident base |
 Singapore Eurasian Singapore Eurasian | 0.7% | Singapore 2020 Census, Eurasian / Other (~0.7%, ~28,000+); the small but historically distinctive Eurasian community of Singapore, descended primarily from Portuguese, Dutch, and British colonial-era settlers and their Asian admixed descendants. Concentrated in historically Eurasian neighborhoods plus general dispersion. Also includes other smaller communities not classified as Chinese, Malay, or Indian |
Singapore Phenotype Profile
Singapore is a multi-ethnic city-state with a constitutionally-defined Chinese-Malay-Indian-Other (CMIO) demographic framework: Chinese (~75%), Malay (~13.5%), Indian (~9%), Eurasian / Other (~0.7%), plus the substantial non-resident foreign-worker population (~28% of total resident population including non-residents). The country's demographic structure reflects approximately 200+ years of population processes since the 1819 British founding of Singapore as a free port — the substantial 19th-c. Chinese (predominantly Hokkien, Teochew, Cantonese, Hakka, Hainanese sub-populations from Fujian and Guangdong) and Indian (predominantly Tamil-source) immigration plus the longer-resident Malay populations of the broader Riau-Lingga and Peninsular-Malaysia source regions.
Genome-wide patterns reflect the multi-source-population structure: Chinese-Singaporean populations cluster with Southern Han Chinese populations (Hokkien, Teochew, Cantonese-source patterns); Malay-Singaporean populations cluster with broader Malaysian Malay / Indonesian populations; Indian-Singaporean populations cluster predominantly with South Indian Tamil populations.
Skin tone across the population spans Fitzpatrick II-V with III-IV the modal range nationally — substantial variation across the major ethnic groups. Hair texture is predominantly straight (Andre Walker 1A-1B) for Chinese and Indian populations; Malay populations show some wavy textures; Eurasian populations show variability. Hair color is predominantly black or very dark brown across the broader population. Eye color is predominantly brown to dark brown across the broader population. Facial features track the source-population distinctions across Chinese, Malay, Indian, Eurasian sub-populations. Build varies by ethnic group; adult Singapore male mean stature is approximately 170-173 cm in 2010s-2020s cohorts (Chinese-Singaporean and Indian-Singaporean populations are slightly taller than Malay-Singaporean).
Singapore Body & Anatomy Reference
Per-feature anatomical profile for AI nude generation: Southeast Asian Austronesian / Austroasiatic phenotype dominant in Singapore
Singapore Women: Boobs & Breasts
Singapore women's tits and boobs reflect the small-to-medium cup, modest projection Southeast Asian Austronesian / Austroasiatic bust profile dominant in the Singapore demographic composition. Singapore nipples and areolas show medium-brown to dark-brown areolar pigmentation against the tan-to-medium-brown skin tone, with areolar diameter typically in the 26-38mm range, distinct from the the fuller South Asian or Polynesian bust. Singapore breast morphology trends firm, modest projection, a function of the ectomorph, petite frame body habitus and mean adult female BMI 20-23. For anatomically-accurate AI-generated Singapore nude women the render should preserve: small-to-medium cup, modest projection shape, 26-38mm areolas with regional pigmentation, and the torso proportions of the Southeast Asian Austronesian / Austroasiatic phenotype.
Singapore Women: Ass & Hips
Singapore women's ass and hip morphology presents as small-to-medium, modest projection, narrower hip profile, distinctly different from the fuller glutes of the Pacific Islander phenotype. Singapore pelvic profile shows narrow-to-medium iliac crests, anchored in the Southeast Asian Austronesian / Austroasiatic skeletal pattern that dominates the Singapore ethnic composition. Singapore butt shots in adult AI imagery should render the small-to-medium, modest projection, narrower hip profile silhouette with the ectomorph, petite frame build and the gluteal-femoral fat distribution typical of the Southeast Asian Austronesian / Austroasiatic phenotype rather than defaulting to a globally-averaged shape that generic AI generators produce.
Singapore Women: Vagina & Pussy
Singapore women's pussy and vulvar anatomy presents medium-brown to dark-brown labial pigmentation, consistent with the Southeast Asian Austronesian / Austroasiatic phenotype's pigmentation pattern dominant in Singapore. Singapore pubic hair is typically straight-to-wavy fine-to-medium texture, distributed in the inverted-triangle pattern with regional-typical density. AI-generated Singapore nude imagery should preserve the medium-brown to dark-brown labial pigmentation and the straight-to-wavy fine-to-medium texture hair texture rather than defaulting to a Western-European pink-and-sparse template. For anatomically-accurate Singapore pussy renders the labial pigmentation should match the surrounding tan to medium-brown skin tone of the Southeast Asian Austronesian / Austroasiatic phenotype.
Singapore Men: Dicks & Penis
Singapore men's dick and penile anatomy in adult AI generation should anchor on the regional reference data: regional mean ~11cm erect, moderate girth, and medium-brown shaft pigmentation. Singapore cock profile reflects the Southeast Asian Austronesian / Austroasiatic ancestral population's anthropometric measurements rather than a globally-averaged Western-pornography default. For anatomically-accurate Singapore nude male imagery the shaft pigmentation should track the surrounding tan to medium-brown skin tone, with continuous glans-to-shaft pigmentation transition and the straight-to-wavy fine-to-medium texture pubic-hair texture distributed in the typical inverted-V escutcheon. Circumcision status across Singapore men varies by religious and cultural tradition rather than ancestral phenotype.
Singapore People: Body, Curves & Build
Singapore body type and overall build presents as ectomorph, petite frame, with mean adult female BMI 20-23: the characteristic Southeast Asian Austronesian / Austroasiatic habitus dominant in the Singapore demographic composition. Singapore curves and proportions in adult AI imagery should preserve the regional skeletal frame (height, shoulder-to-hip ratio, limb proportions) rather than scaling to a Western-European mesomorph default. The Singapore nude female form, when rendered with anatomical fidelity, shows the height range, frame width, and adipose distribution pattern typical of the Southeast Asian Austronesian / Austroasiatic phenotype. Generic AI image generators tend to collapse regional body types into a few default shapes; the Ethnic Erotic phenotype-anchored approach preserves the Singapore build as its own reference category.
Singapore People: Skin Tone & Hair Texture
Singapore skin tone falls in the tan to medium-brown (Fitzpatrick III-V) band, the surface signal most often miscalibrated by generic AI nude generators trained on Western-photographic datasets. Singapore hair texture is typically straight-to-wavy 1A-2A, dark-brown to black, characteristic of the Southeast Asian Austronesian / Austroasiatic phenotype. For anatomically-accurate Singapore nude renders the skin should hold the Fitzpatrick band consistently across body surface rather than showing the lighter-than-face body shading that AI generators default to. Singapore hair pigmentation and texture on body, pubic, and head should match across the figure rather than mixing textures (a common AI artefact).
A descriptive view, not a claim about individuals
This page shows a weighted aggregate of phenotype observations across the Singapore population, based on demographic composition from published census and ancestry sources. Phenotypes within any country are far more varied than the aggregate suggests; this is a descriptive reference, not a deterministic claim about any individual. For source-level detail on individual ethnic groups, see the constituent atlas pages linked below.
Methodology Notes
Composition weights are derived from the Department of Statistics Singapore 2020 Census, the most recent comprehensive Singaporean census. Singapore enumerates ethnic group under the constitutional Chinese-Malay-Indian-Other (CMIO) framework which has been substantially institutionalized in housing-policy, education-policy, and political-representation arrangements. Caveats: (1) the CMIO framework simplifies substantial within-category diversity, particularly the diverse Chinese-Singaporean dialect-group sub-populations and the diverse Indian-Singaporean sub-populations; (2) the Eurasian / Other category aggregates demographically distinct sub-populations; (3) Singapore's substantial non-resident foreign-worker population (~1.6M+ as of 2020, comprising approximately 28% of the broader resident population) is partially captured in this composition but produces substantial demographic complexity; (4) the post-2010 mainland Chinese immigration plus Indian-IT-professional immigration has shifted Singaporean demographics in ways that the broader CMIO framework partially obscures.
Primary Sources
- 1.Department of Statistics Singapore. Census of Population 2020 Statistical Release. Singapore: DOS; 2021.
- 2.Lai AE (ed). Beyond Rituals and Riots: Ethnic Pluralism and Social Cohesion in Singapore. ISEAS-Yusof Ishak Institute; 2004.
- 3.Saw SH. The Population of Singapore (3rd ed). ISEAS-Yusof Ishak Institute; 2012.
- 4.Sandhu KS, Mani A (eds). Indian Communities in Southeast Asia (2nd ed). ISEAS-Yusof Ishak Institute; 2006.
- 5.Pereira AA. The Eurasian Association: An Ethnic Self-Help Organization. In: Lai AE (ed). Beyond Rituals and Riots. ISEAS; 2004.
Other countries in Southeast Asia
Aggregate phenotype references for neighbouring Southeast Asia nations, weighted by demographic composition.