Help us get this right
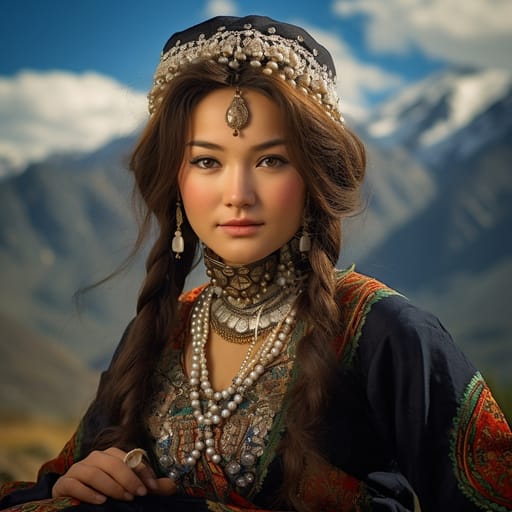
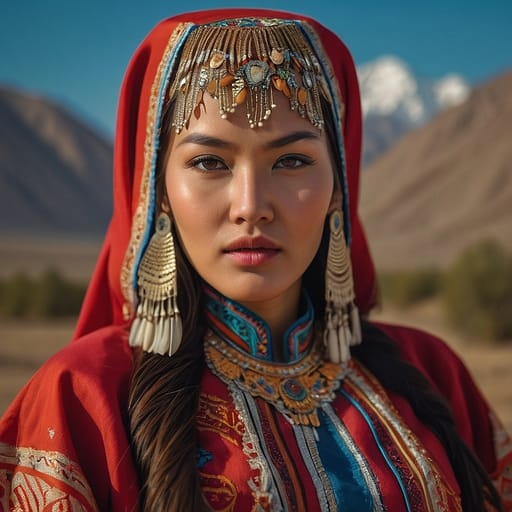
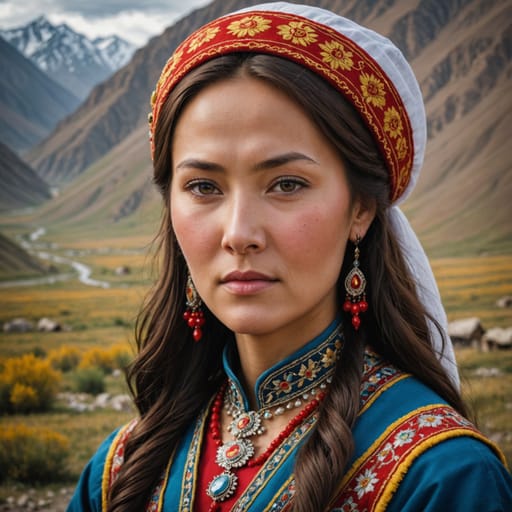
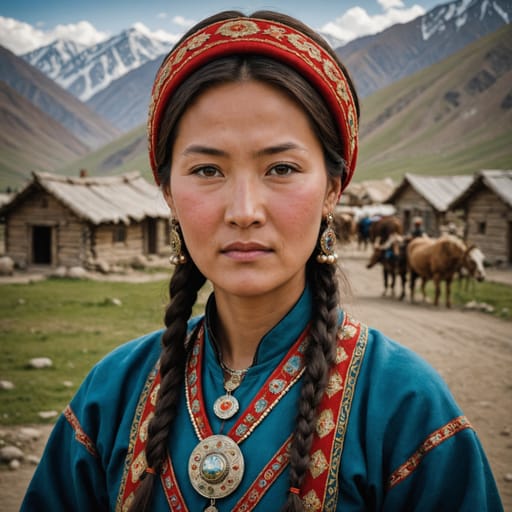
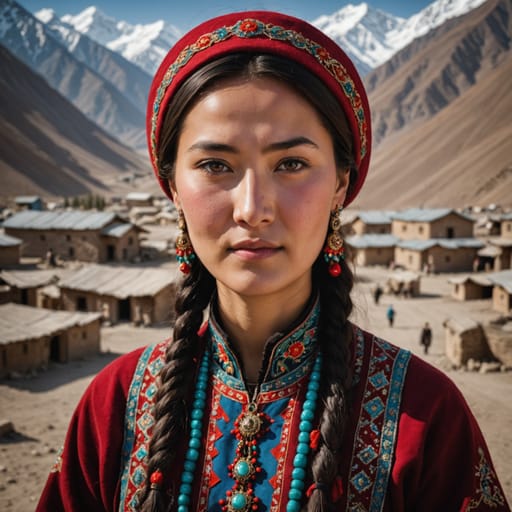
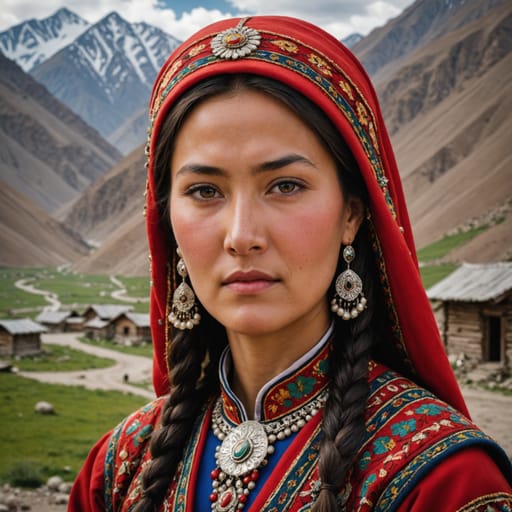
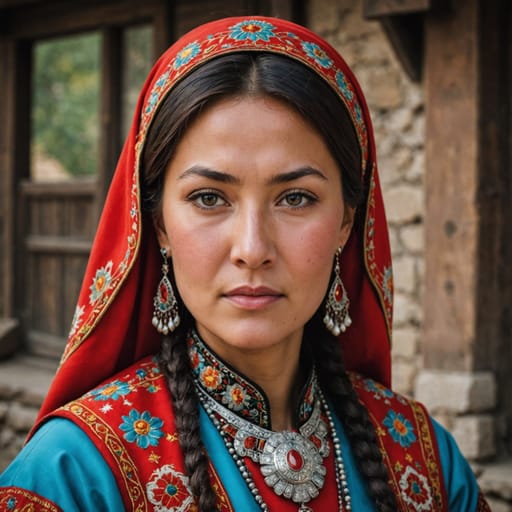
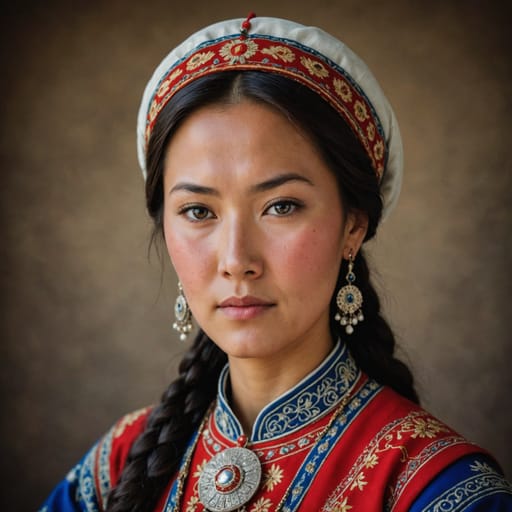
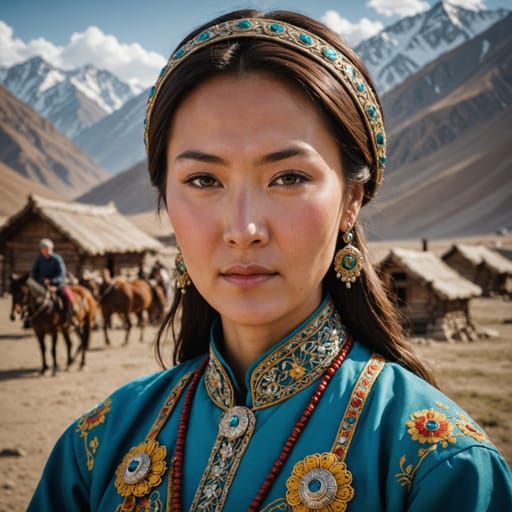
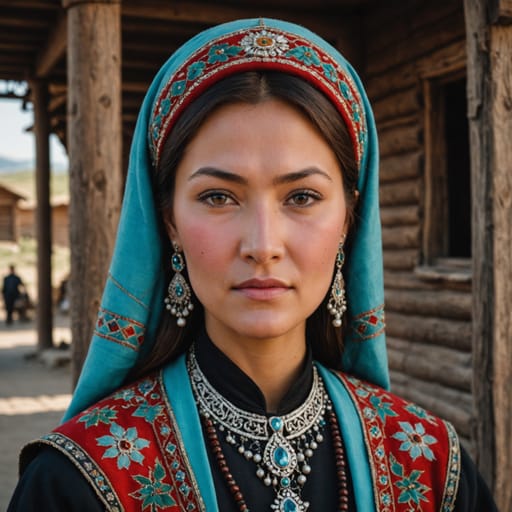
Does this portrait look right for Kyrgyz?
One tap. It takes a second and it is recorded.
5 say it looks right, 0 say it looks off.

Kyrgyzstan
KGCentral Asia
Kyrgyzstan is home to 12 documented ethnic groups in Central Asia, led by Kyrgyz (~74%), Uzbek Kyrgyzstan (~15%), Russian Kyrgyzstan (~5%), Dungan Kyrgyzstan (~1%). This page blends their phenotype and demographic data into one weighted reference: skin tone, facial features, hair texture and build, drawn from published census and ancestry sources.
Demographic Composition
Composition weights are derived from self-identification in published census and demographic surveys. Each row links to the source ethnic-group atlas page.
| Ethnic group | Weight | Source |
|---|---|---|
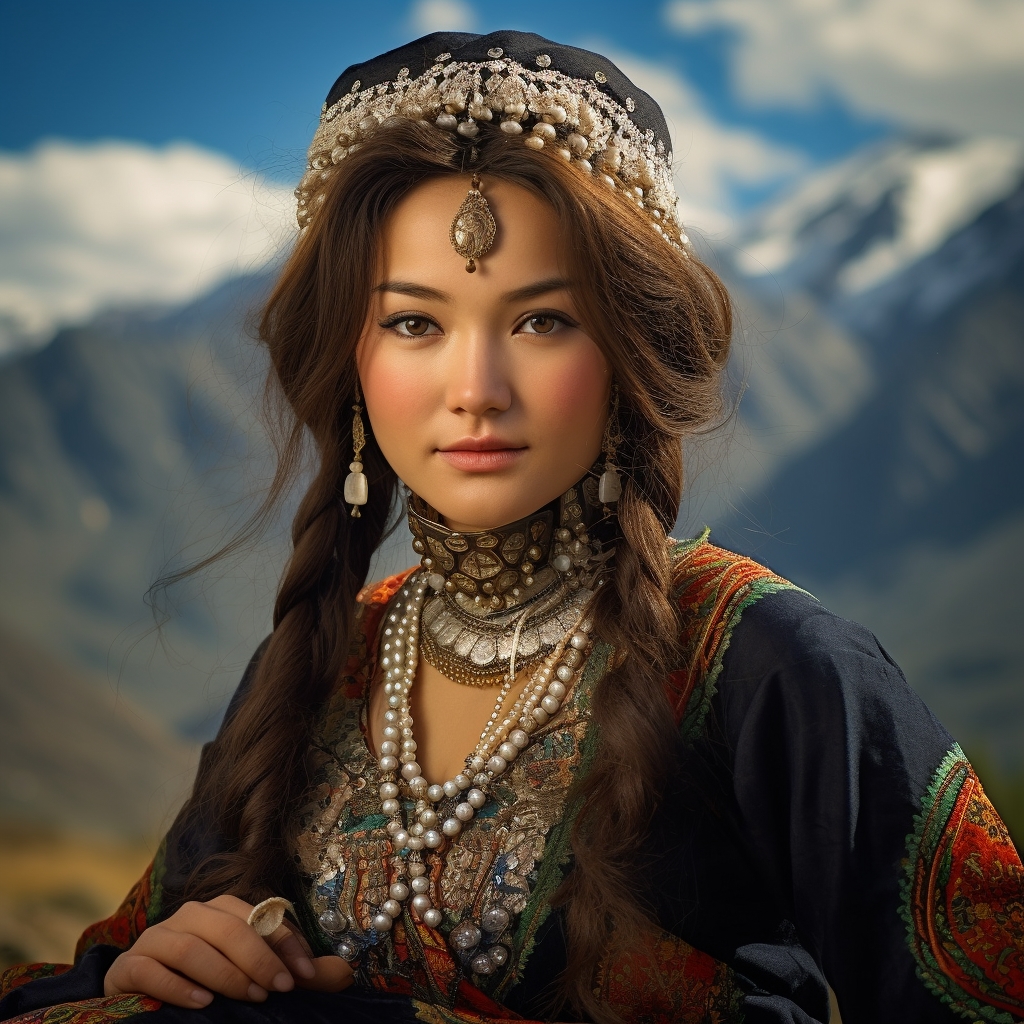 Kyrgyz Kyrgyz | 73.7% | National Statistical Committee of the Kyrgyz Republic 2022 demographic estimates plus 2009 census data; self-identified Kyrgyz (~73.7%, ~5.0M of ~6.8M total population). Growth from ~52.4% in 1989 reflecting both natural increase and the substantial post-1991 ethnic-Russian and ethnic-Ukrainian emigration |
 Uzbek Kyrgyzstan Uzbek Kyrgyzstan | 14.6% | Kyrgyzstan demographic statistics 2022, self-identified Uzbek (~14.6%, ~995,000); concentrated in southern Kyrgyzstan (Osh, Jalal-Abad, Batken regions) in the densely-populated Fergana Valley. The largest ethnic minority. Subject to documented inter-ethnic violence in 2010 (the Osh-Jalal-Abad Kyrgyz-Uzbek riots) |
 Russian Kyrgyzstan Russian Kyrgyzstan | 5.4% | Kyrgyzstan demographic statistics 2022, self-identified Russian (~5.4%, ~365,000); declined substantially from ~21.5% in 1989 (~917,000) through substantial post-1991 emigration to Russia. Concentrated in Bishkek and other major cities |
 Dungan Kyrgyzstan Dungan Kyrgyzstan | 1.1% | Kyrgyzstan demographic statistics 2022, self-identified Dungan (~1.1%, ~73,000); the Sinophone Muslim ethnic group descended from the post-1862 Dungan Revolt refugees who fled Qing-period China. The largest national Dungan population. Concentrated in Chuy Region near the Kazakh border. Speaks Dungan language |
 Uyghur Kyrgyzstan Uyghur Kyrgyzstan | 0.9% | Kyrgyzstan demographic statistics 2022, self-identified Uyghur (~0.9%, ~62,000); concentrated in Bishkek and Issyk-Kul Region. Cross-border population shared with Xinjiang, China |
 Tajik Kyrgyzstan Tajik Kyrgyzstan | 0.9% | Kyrgyzstan demographic statistics 2022, self-identified Tajik (~0.9%, ~63,000); concentrated in Batken Region in southwestern Kyrgyzstan along the Tajik border. Cross-border population |
 Turkish Kyrgyzstan Turkish Kyrgyzstan | 0.9% | Kyrgyzstan demographic statistics 2022, self-identified Turkish (~0.9%, ~62,000); predominantly Meskhetian Turks deported from Georgia to Kyrgyzstan in 1944 under Stalin |
 Other Kyrgyzstan Other Kyrgyzstan | 0.8% | Kyrgyzstan demographic statistics 2022, residual including German, Azerbaijani, Belarusian, Chechen, Kurd, Lezgin, plus other groups |
 Kazakh Kyrgyzstan Kazakh Kyrgyzstan | 0.6% | Kyrgyzstan demographic statistics 2022, self-identified Kazakh (~0.6%, ~40,000) |
 Tatar Kyrgyzstan Tatar Kyrgyzstan | 0.5% | Kyrgyzstan demographic statistics 2022, self-identified Tatar (~0.5%, ~33,000) |
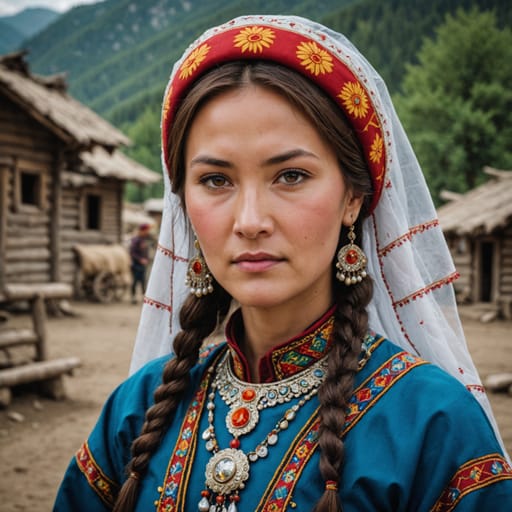 Ukrainian Kyrgyzstan Ukrainian Kyrgyzstan | 0.3% | Kyrgyzstan demographic statistics 2022, self-identified Ukrainian (~0.3%, ~23,000); declined substantially from earlier shares |
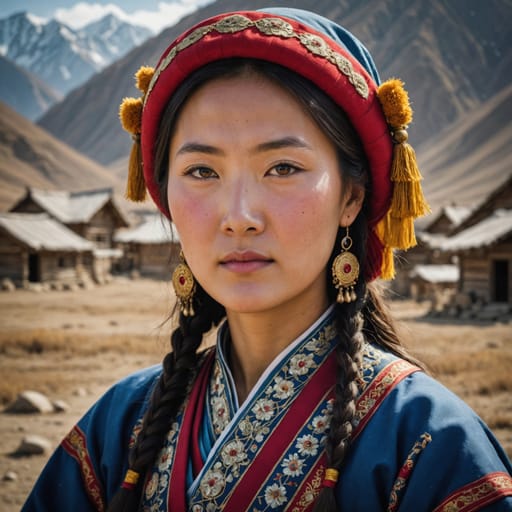 Korean Kyrgyzstan Korean Kyrgyzstan | 0.3% | Kyrgyzstan demographic statistics 2022, self-identified Korean (~0.3%, ~17,000); the Koryo-saram community |
Kyrgyzstan Phenotype Profile
Kyrgyzstan's population is dominated by Kyrgyz (~74% per 2022 demographic estimates) with the substantial Uzbek minority (~14.6%, concentrated in the Fergana Valley) plus the declining Russian minority (~5.4%, declined from ~21.5% in 1989) plus smaller Dungan, Uyghur, Tajik, Meskhetian Turkish, Korean, Tatar, and Ukrainian communities. The country's demographic structure reflects the Yenisei-Kyrgyz ethnogenesis, the medieval migration to and consolidation in the Tian Shan region, the 19th-c. Russian imperial conquest, the Soviet-era population movements (the 1937 Korean deportation, the 1944 Meskhetian Turkish deportation), and the post-1991 demographic re-shifting through Russian-Ukrainian-German emigration. The 1990 and 2010 Kyrgyz-Uzbek inter-ethnic violence in Osh and Jalal-Abad has created significant social tension that continues to shape Kyrgyz-Uzbek relations.
Genome-wide patterns place Kyrgyz populations at approximately 60-70% East Asian / Mongol-source and 30-40% West Eurasian — similar to Kazakh populations and somewhat more East-Asian-shifted than Uzbek populations. Skin tone across the broader Kyrgyz population spans Fitzpatrick II-IV with III the modal value. Hair is predominantly straight to wavy black to dark brown with some lighter variants. Facial features show characteristic Kipchak Turkic / Mongol-source-population features (epicanthic-fold variants common, broader face shapes with prominent cheekbones, narrower-to-moderate nasal bridges). Eye color is predominantly brown with elevated frequencies of hazel and lighter variants. The Russian-Kyrgyzstan and Ukrainian-Kyrgyzstan minority populations show characteristic Eastern Slavic source-population features (lighter skin tones, broader hair-color and eye-color distributions). The Dungan minority shows characteristic Northwestern Han Chinese / Hui source-population features. Build is intermediate; adult Kyrgyz male mean stature is approximately 173 cm in 2010s-2020s cohorts.
Kyrgyzstan Body & Anatomy Reference
Per-feature anatomical profile for AI nude generation: Central Asian Turkic-Mongolic phenotype dominant in Kyrgyzstan
Kyrgyzstan Women: Boobs & Breasts
Kyrgyzstan women's tits and boobs reflect the medium cup, moderate projection Central Asian Turkic-Mongolic bust profile dominant in the Kyrgyzstan demographic composition. Kyrgyzstan nipples and areolas show medium-brown areolar pigmentation against the tan-to-light-brown skin tone, with areolar diameter typically in the 30-42mm range, distinct from the the smaller East Asian bust. Kyrgyzstan breast morphology trends full and modestly projecting, a function of the mesomorph, broader frame than the East Asian norm body habitus and mean adult female BMI 23-26. For anatomically-accurate AI-generated Kyrgyzstan nude women the render should preserve: medium cup, moderate projection shape, 30-42mm areolas with regional pigmentation, and the torso proportions of the Central Asian Turkic-Mongolic phenotype.
Kyrgyzstan Women: Ass & Hips
Kyrgyzstan women's ass and hip morphology presents as medium, moderate projection, broader hip profile than the East Asian norm, distinctly different from the slim East Asian narrow-hip profile. Kyrgyzstan pelvic profile shows medium iliac crests, moderate gluteal-femoral fat deposition, anchored in the Central Asian Turkic-Mongolic skeletal pattern that dominates the Kyrgyzstan ethnic composition. Kyrgyzstan butt shots in adult AI imagery should render the medium, moderate projection, broader hip profile than the East Asian norm silhouette with the mesomorph, broader frame than the East Asian norm build and the gluteal-femoral fat distribution typical of the Central Asian Turkic-Mongolic phenotype rather than defaulting to a globally-averaged shape that generic AI generators produce.
Kyrgyzstan Women: Vagina & Pussy
Kyrgyzstan women's pussy and vulvar anatomy presents medium-brown labial pigmentation, consistent with the Central Asian Turkic-Mongolic phenotype's pigmentation pattern dominant in Kyrgyzstan. Kyrgyzstan pubic hair is typically straight-to-wavy medium-coarse texture, distributed in the inverted-triangle pattern with regional-typical density. AI-generated Kyrgyzstan nude imagery should preserve the medium-brown labial pigmentation and the straight-to-wavy medium-coarse texture hair texture rather than defaulting to a Western-European pink-and-sparse template. For anatomically-accurate Kyrgyzstan pussy renders the labial pigmentation should match the surrounding tan to light-brown skin tone of the Central Asian Turkic-Mongolic phenotype.
Kyrgyzstan Men: Dicks & Penis
Kyrgyzstan men's dick and penile anatomy in adult AI generation should anchor on the regional reference data: regional mean ~13cm erect, moderate girth, and medium-brown shaft pigmentation. Kyrgyzstan cock profile reflects the Central Asian Turkic-Mongolic ancestral population's anthropometric measurements rather than a globally-averaged Western-pornography default. For anatomically-accurate Kyrgyzstan nude male imagery the shaft pigmentation should track the surrounding tan to light-brown skin tone, with continuous glans-to-shaft pigmentation transition and the straight-to-wavy medium-coarse texture pubic-hair texture distributed in the typical inverted-V escutcheon. Circumcision status across Kyrgyzstan men varies by religious and cultural tradition rather than ancestral phenotype.
Kyrgyzstan People: Body, Curves & Build
Kyrgyzstan body type and overall build presents as mesomorph, broader frame than the East Asian norm, with mean adult female BMI 23-26: the characteristic Central Asian Turkic-Mongolic habitus dominant in the Kyrgyzstan demographic composition. Kyrgyzstan curves and proportions in adult AI imagery should preserve the regional skeletal frame (height, shoulder-to-hip ratio, limb proportions) rather than scaling to a Western-European mesomorph default. The Kyrgyzstan nude female form, when rendered with anatomical fidelity, shows the height range, frame width, and adipose distribution pattern typical of the Central Asian Turkic-Mongolic phenotype. Generic AI image generators tend to collapse regional body types into a few default shapes; the Ethnic Erotic phenotype-anchored approach preserves the Kyrgyzstan build as its own reference category.
Kyrgyzstan People: Skin Tone & Hair Texture
Kyrgyzstan skin tone falls in the tan to light-brown (Fitzpatrick III-IV) band, the surface signal most often miscalibrated by generic AI nude generators trained on Western-photographic datasets. Kyrgyzstan hair texture is typically straight 1A-1B, dark-brown to black, characteristic of the Central Asian Turkic-Mongolic phenotype. For anatomically-accurate Kyrgyzstan nude renders the skin should hold the Fitzpatrick band consistently across body surface rather than showing the lighter-than-face body shading that AI generators default to. Kyrgyzstan hair pigmentation and texture on body, pubic, and head should match across the figure rather than mixing textures (a common AI artefact).
A descriptive view, not a claim about individuals
This page shows a weighted aggregate of phenotype observations across the Kyrgyzstan population, based on demographic composition from published census and ancestry sources. Phenotypes within any country are far more varied than the aggregate suggests; this is a descriptive reference, not a deterministic claim about any individual. For source-level detail on individual ethnic groups, see the constituent atlas pages linked below.
Methodology Notes
Composition weights are derived from the National Statistical Committee of the Kyrgyz Republic 2022 demographic estimates plus 2009 census data. Kyrgyzstan has not conducted a comprehensive census since 2009 (the planned 2020 census was delayed by the COVID-19 pandemic and political disruption); 2022 estimates are derived from administrative-data-based modeling. Caveats: (1) the absence of a recent comprehensive census means composition weights are estimates rather than direct enumeration; (2) the post-1991 Russian-Ukrainian-German emigration has substantially altered demographics from the 1989 Soviet-era baseline; (3) the Kyrgyz-Uzbek inter-ethnic tensions in southern Kyrgyzstan have produced documented Uzbek out-migration following the 1990 and 2010 violence; (4) the various Kyrgyz tribal confederations (Sol Kanat, Ong Kanat, Ichkilik) maintain meaningful cultural and partial-genetic distinctness but are not separately enumerated in census instruments; (5) the Dungan community is the largest national Dungan population and represents an unusually well-preserved diaspora Sinitic-language community.
Primary Sources
- 1.National Statistical Committee of the Kyrgyz Republic. Population and Housing Census 2009 / Demographic Yearbook 2022. Bishkek: NSC; 2022.
- 2.Yunusbayev B, Metspalu M, Metspalu E, et al. The genetic legacy of the expansion of Turkic-speaking nomads across Eurasia. PLoS Genet. 2015;11(4):e1005068.
- 3.Marat E. Labor Migration in Central Asia: Implications of the Global Economic Crisis. Silk Road Studies Program; 2009.
- 4.Reeves M. Border Work: Spatial Lives of the State in Rural Central Asia. Ithaca: Cornell University Press; 2014.
- 5.Megoran N. The Fergana Valley: The Heart of Central Asia. ME Sharpe; 2011.
Other countries in Central Asia
Aggregate phenotype references for neighbouring Central Asia nations, weighted by demographic composition.