Help us get this right
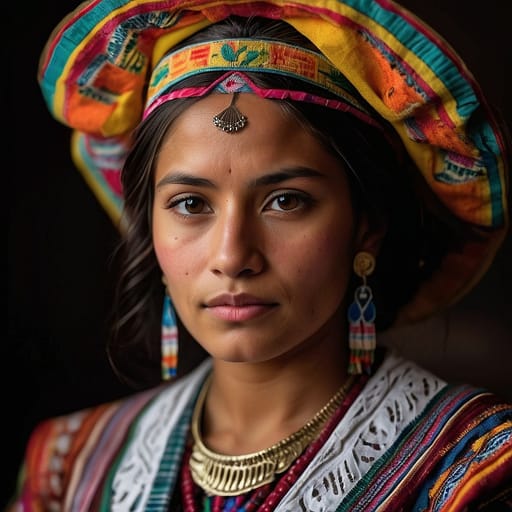
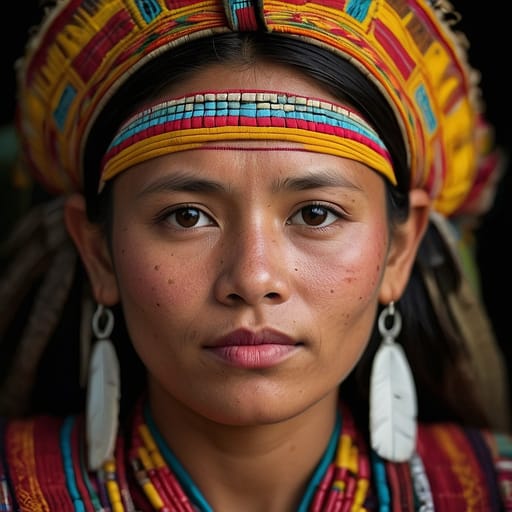
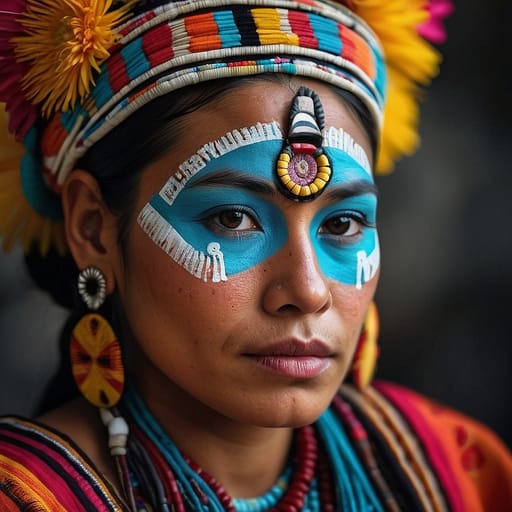
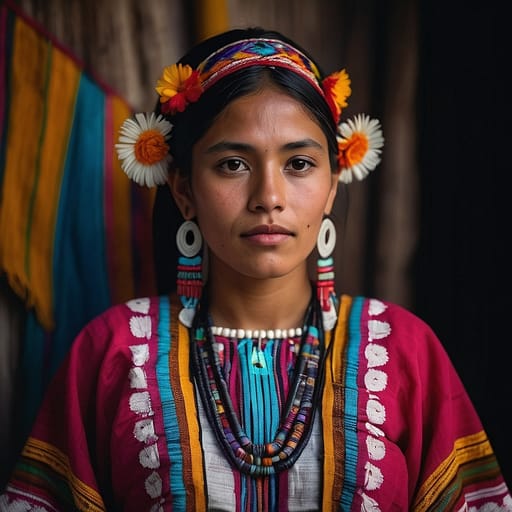
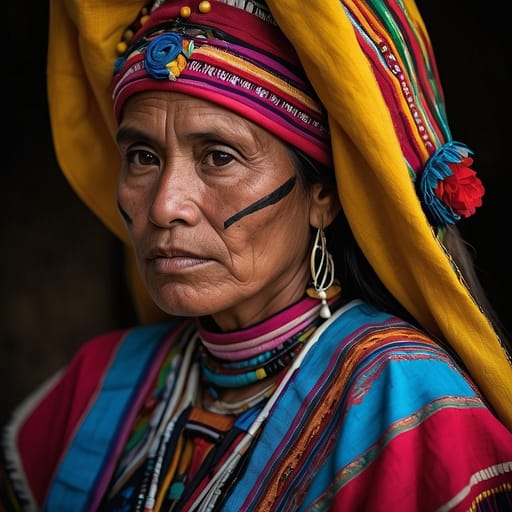
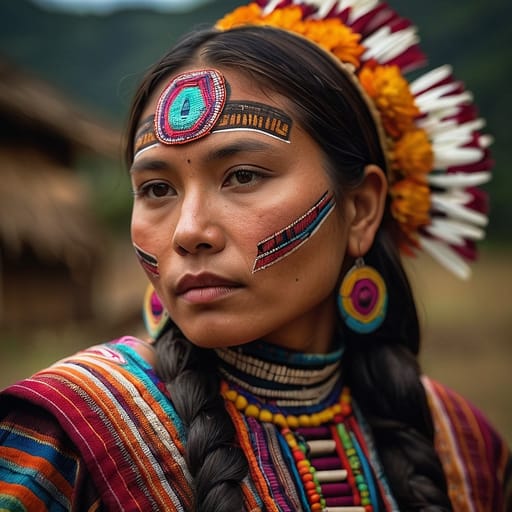
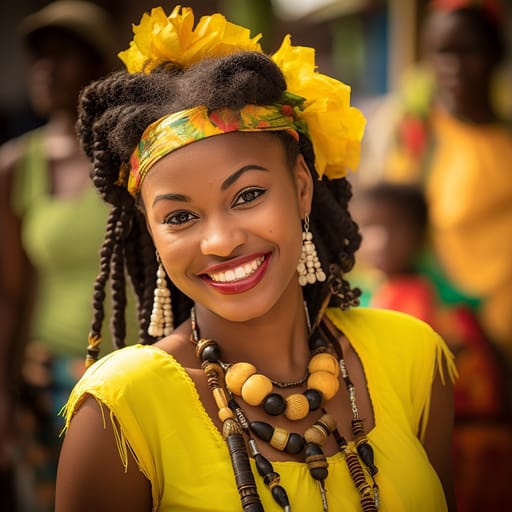
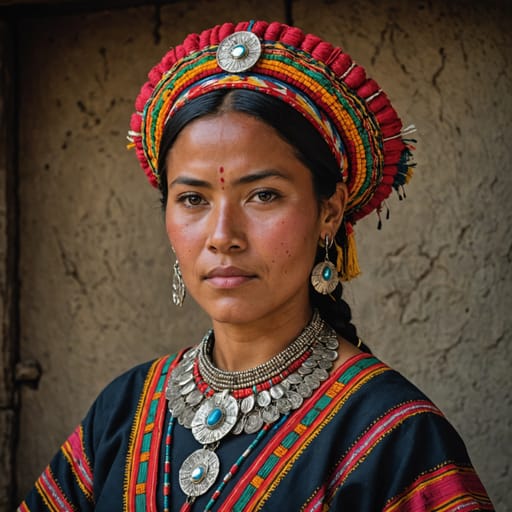
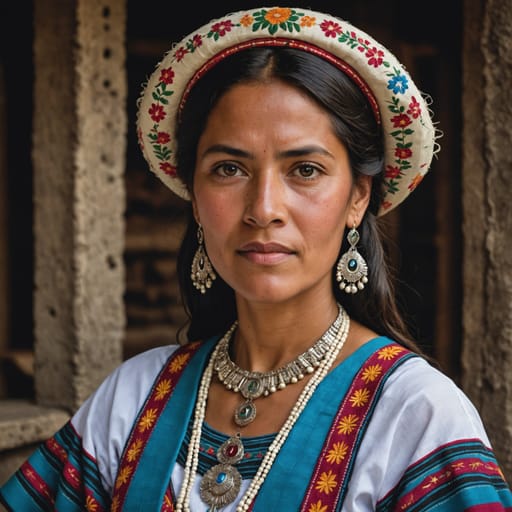
Does this portrait look right for Ladino Guatemalan?
One tap. It takes a second and it is recorded.
1 says it looks right, 0 say it looks off.
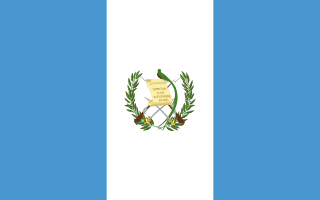

Guatemala
GTLatin America
Guatemala is home to 9 documented ethnic groups in Latin America, led by Ladino Guatemalan (~56%), Kiche Maya (~11%), Qeqchi Maya (~9%), Other Maya Guatemalan (~8%). This page blends their phenotype and demographic data into one weighted reference: skin tone, facial features, hair texture and build, drawn from published census and ancestry sources.
Demographic Composition
Composition weights are derived from self-identification in published census and demographic surveys. Each row links to the source ethnic-group atlas page.
| Ethnic group | Weight | Source |
|---|---|---|
 Ladino Guatemalan Ladino Guatemalan | 56.1% | INE 2018 Census (XII Censo Nacional de Población y VII de Vivienda 2018), self-identified ladino/mestizo (~56.1%); the dominant national identity, encompassing Spanish-speaking, Spanish-and-Indigenous-descended population that does not self-identify with a specific Maya group. Concentrated in Guatemala City, the Pacific coastal departments, and the eastern departments |
 Kiche Maya Kiche Maya | 11.1% | INE 2018 Census, self-identified Maya K'iche' (~11.1%, ~1.93M); the largest single Indigenous group in Guatemala, concentrated in the western highland departments of Quiché, Totonicapán, Sololá, Quetzaltenango, Suchitepéquez, and Retalhuleu |
 Qeqchi Maya Qeqchi Maya | 8.5% | INE 2018 Census, self-identified Maya Q'eqchi' (~8.5%, ~1.48M); concentrated in Alta Verapaz, Baja Verapaz, Izabal, Petén, and parts of Quiché and Belize |
 Other Maya Guatemalan Other Maya Guatemalan | 8.3% | INE 2018 Census, self-identified other Maya peoples (~8.3% combined): Q'anjob'al (~160K), Ixil (~133K), Tz'utujil (~84K), Poqomchi' (~125K), Ch'orti' (~58K), Achi (~109K), Akateko, Awakateko, Chuj, Itzaj, Jakalteko/Popti', Mopan, Poqomam, Sakapulteko, Sipakapense, Tektiteko, Uspanteko |
 Mam Maya Mam Maya | 7.8% | INE 2018 Census, self-identified Maya Mam (~7.8%, ~1.36M); concentrated in Huehuetenango, San Marcos, and Quetzaltenango |
 Kaqchikel Maya Kaqchikel Maya | 7.7% | INE 2018 Census, self-identified Maya Kaqchikel (~7.7%, ~1.34M); concentrated in Sacatepéquez, Chimaltenango, Guatemala department, parts of Sololá, and Suchitepéquez |
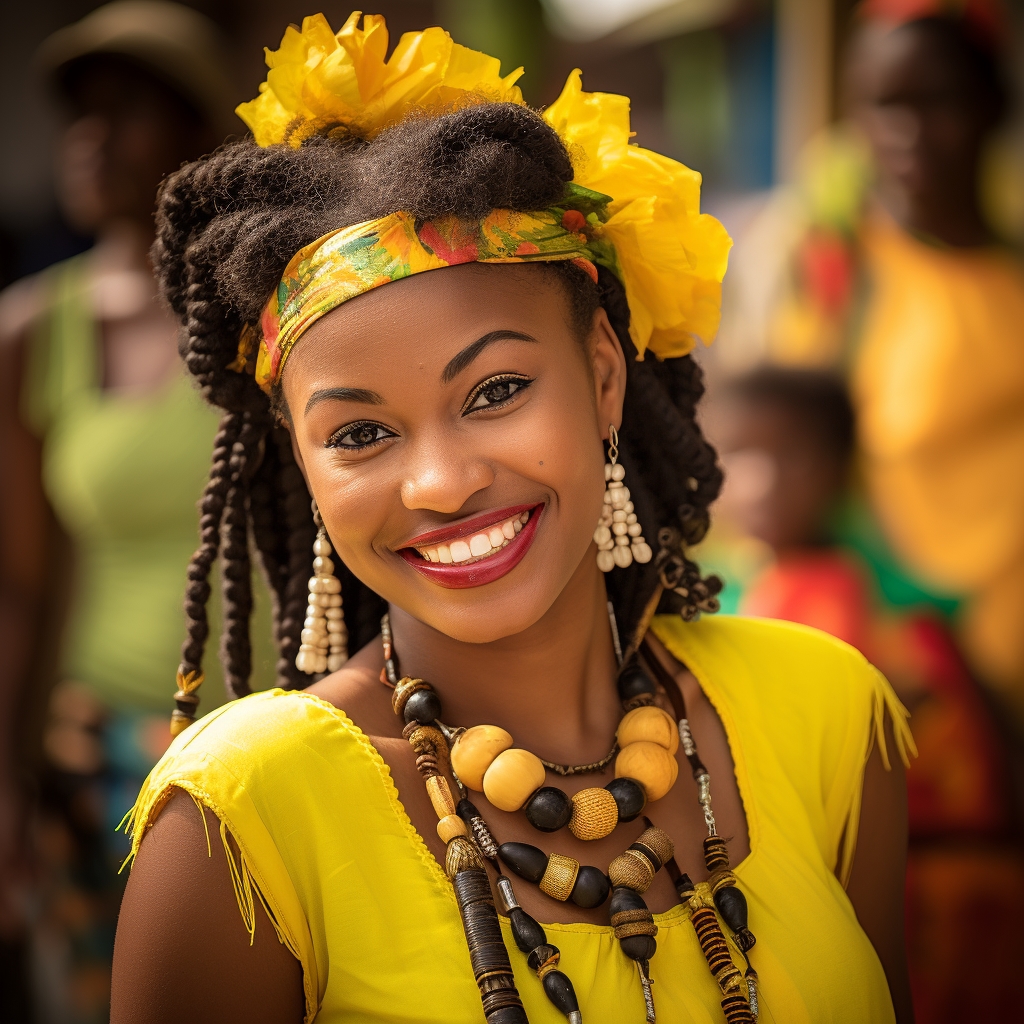 Garifuna Garifuna | 0.2% | INE 2018 Census, self-identified Garífuna (~0.2%, ~25,000); concentrated in Livingston (Izabal Department) and other Caribbean coastal communities; descendants of the 1797 St. Vincent deportation of Black Caribs / Garinagu |
 Xinka Xinka | 0.2% | INE 2018 Census, self-identified Xinka (~0.2%, ~26,000); a non-Maya Indigenous people of southeastern Guatemala (Santa Rosa, Jalapa, Jutiapa departments), with the Xinkan language now considered moribund or extinct as a primary language |
 White Guatemalan White Guatemalan | 0.1% | INE 2018 Census, self-identified blanco (~0.1%); concentrated in Guatemala City, with substantial 19th-20th c. immigration from Spain, Germany, Italy, Lebanon-Syria, and the United States |
Guatemala Phenotype Profile
Guatemala has the highest Maya-Indigenous population share in Central America — approximately 41% of Guatemalans self-identified as Maya in the 2018 INE census across approximately 22 recognized Maya peoples, plus 0.2% Xinka and 0.2% Garífuna for a combined Indigenous self-identification share of ~42%. The remaining ~58% self-identifies as Ladino (~56%) or white (~0.1%), with ~2% other or no response. The K'iche' (~11%), Q'eqchi' (~9%), Mam (~8%), and Kaqchikel (~8%) are the four largest Maya groups, together comprising ~36% of the national population. Genome-wide studies (Söchtig et al. 2015, Hellenthal et al. 2014) place average national ancestry at approximately 55-65% Indigenous American, 30-40% European, and 1-5% African, with strong regional patterning — western highland departments carry 75-90% Indigenous ancestry while Guatemala City, the Pacific coast, and eastern departments carry substantially higher European admixture.
Skin tone across the population spans Fitzpatrick II-V with III-IV the modal range nationally. The western highland departments (Huehuetenango, Quiché, Totonicapán, Sololá, Quetzaltenango, San Marcos, Chimaltenango) carry Maya-majority populations with characteristic Mesoamerican Indigenous phenotype distribution: Fitzpatrick III-IV, copper-bronze undertone, uniform straight black hair, moderate to high epicanthic-fold frequency, broader nasal bases, prominent cheekbones, full lips, and stature substantially below the broader Latin American average. Guatemala City and the Pacific coast carry Ladino-majority populations with intermediate phenotype distribution. The eastern departments (Chiquimula, Jutiapa, Jalapa, Zacapa, El Progreso, Santa Rosa) carry Ladino-majority populations with higher European-admixture distribution. The Caribbean coast (Izabal, especially Livingston) hosts the small but distinctive Garífuna Afro-Indigenous population. The 1980-1996 civil war and the subsequent emigration wave have produced a substantial Guatemalan-American diaspora that skews more Maya than the source population, particularly Mam, K'iche', and Q'anjob'al communities in the United States.
Guatemala Body & Anatomy Reference
Per-feature anatomical profile for AI nude generation: South American Indigenous / European-Mestizo / Afro-Latino mix phenotype dominant in Guatemala
Guatemala Women: Boobs & Breasts
Guatemala women's tits and boobs reflect the medium-to-large cup, full, high projection South American Indigenous / European-Mestizo / Afro-Latino mix bust profile dominant in the Guatemala demographic composition. Guatemala nipples and areolas show medium-brown to dark-brown areolar pigmentation against the tan-to-deep-brown skin tone, with areolar diameter typically in the 32-46mm range, distinct from the the smaller bust profile of Andean Indigenous sub-populations. Guatemala breast morphology trends the classic Brazilian / Latina curvy bust profile in lowland populations; smaller and shorter-set in Andean Indigenous populations, a function of the endomorph-to-mesomorph with high gluteal-femoral deposition body habitus and mean adult female BMI 25-28. For anatomically-accurate AI-generated Guatemala nude women the render should preserve: medium-to-large cup, full, high projection shape, 32-46mm areolas with regional pigmentation, and the torso proportions of the South American Indigenous / European-Mestizo / Afro-Latino mix phenotype.
Guatemala Women: Ass & Hips
Guatemala women's ass and hip morphology presents as full, high projection, the famous Brazilian / Latina bunda profile, distinctly different from the slim narrow-hip East Asian profile. Guatemala pelvic profile shows wide iliac crests, very full gluteal-femoral fat deposition (the hallmark Brazilian / Latina hip-to-waist ratio), anchored in the South American Indigenous / European-Mestizo / Afro-Latino mix skeletal pattern that dominates the Guatemala ethnic composition. Guatemala butt shots in adult AI imagery should render the full, high projection, the famous Brazilian / Latina bunda profile silhouette with the endomorph-to-mesomorph with high gluteal-femoral deposition build and the gluteal-femoral fat distribution typical of the South American Indigenous / European-Mestizo / Afro-Latino mix phenotype rather than defaulting to a globally-averaged shape that generic AI generators produce.
Guatemala Women: Vagina & Pussy
Guatemala women's pussy and vulvar anatomy presents medium-brown to dark-brown labial pigmentation, fuller labia minora, consistent with the South American Indigenous / European-Mestizo / Afro-Latino mix phenotype's pigmentation pattern dominant in Guatemala. Guatemala pubic hair is typically wavy-to-curly coarse dark texture, dense distribution, distributed in the inverted-triangle pattern with regional-typical density. AI-generated Guatemala nude imagery should preserve the medium-brown to dark-brown labial pigmentation and the wavy-to-curly coarse dark texture hair texture rather than defaulting to a Western-European pink-and-sparse template. For anatomically-accurate Guatemala pussy renders the labial pigmentation should match the surrounding tan to deep-brown skin tone of the South American Indigenous / European-Mestizo / Afro-Latino mix phenotype.
Guatemala Men: Dicks & Penis
Guatemala men's dick and penile anatomy in adult AI generation should anchor on the regional reference data: regional mean ~13cm erect, moderate-to-above-average girth, and medium-brown shaft pigmentation. Guatemala cock profile reflects the South American Indigenous / European-Mestizo / Afro-Latino mix ancestral population's anthropometric measurements rather than a globally-averaged Western-pornography default. For anatomically-accurate Guatemala nude male imagery the shaft pigmentation should track the surrounding tan to deep-brown skin tone, with continuous glans-to-shaft pigmentation transition and the wavy-to-curly coarse dark texture pubic-hair texture distributed in the typical inverted-V escutcheon. Circumcision status across Guatemala men varies by religious and cultural tradition rather than ancestral phenotype.
Guatemala People: Body, Curves & Build
Guatemala body type and overall build presents as endomorph-to-mesomorph with high gluteal-femoral deposition, with mean adult female BMI 25-28: the characteristic South American Indigenous / European-Mestizo / Afro-Latino mix habitus dominant in the Guatemala demographic composition. Guatemala curves and proportions in adult AI imagery should preserve the regional skeletal frame (height, shoulder-to-hip ratio, limb proportions) rather than scaling to a Western-European mesomorph default. The Guatemala nude female form, when rendered with anatomical fidelity, shows the height range, frame width, and adipose distribution pattern typical of the South American Indigenous / European-Mestizo / Afro-Latino mix phenotype. Generic AI image generators tend to collapse regional body types into a few default shapes; the Ethnic Erotic phenotype-anchored approach preserves the Guatemala build as its own reference category.
Guatemala People: Skin Tone & Hair Texture
Guatemala skin tone falls in the tan to deep-brown (Fitzpatrick III-VI) band, the surface signal most often miscalibrated by generic AI nude generators trained on Western-photographic datasets. Guatemala hair texture is typically straight-to-curly 1A-3C, varies widely by ancestral composition, characteristic of the South American Indigenous / European-Mestizo / Afro-Latino mix phenotype. For anatomically-accurate Guatemala nude renders the skin should hold the Fitzpatrick band consistently across body surface rather than showing the lighter-than-face body shading that AI generators default to. Guatemala hair pigmentation and texture on body, pubic, and head should match across the figure rather than mixing textures (a common AI artefact).
A descriptive view, not a claim about individuals
This page shows a weighted aggregate of phenotype observations across the Guatemala population, based on demographic composition from published census and ancestry sources. Phenotypes within any country are far more varied than the aggregate suggests; this is a descriptive reference, not a deterministic claim about any individual. For source-level detail on individual ethnic groups, see the constituent atlas pages linked below.
Methodology Notes
Composition weights are derived from Guatemala's 2018 INE Census (XII Censo Nacional de Población y VII de Vivienda 2018), which uses self-identification across the constitutionally-recognized ethno-linguistic categories (specific Maya group, Xinka, Garífuna, Ladino, blanco, other). Genome-wide ancestry context (Söchtig et al. 2015, Hellenthal et al. 2014) supports phenotype interpretation. Caveats: (1) the Maya / Ladino self-identification boundary is socially fluid and the 41% Maya self-identification share has historically been subject to substantial reclassification across surveys — earlier 20th c. censuses reported Maya shares of 60%+ that declined through the 20th c. as some Maya-descended individuals shifted to Ladino self-identification; (2) the Ladino category is heterogeneous, encompassing populations with substantially different European-Indigenous ancestry proportions; (3) the 22 Maya groups carry meaningful linguistic and partial cultural distinctness but moderate phenotype distinctness — the umbrella aggregations capture the main demographic structure but obscure within-group variation; (4) the Garífuna and Xinka populations are small numerically but distinctive culturally, linguistically, and (for Garífuna) phenotypically.
Primary Sources
- 1.Instituto Nacional de Estadística (INE). XII Censo Nacional de Población y VII de Vivienda 2018: Resultados del Censo. Guatemala: INE; 2019.
- 2.Söchtig J, Álvarez-Iglesias V, Mosquera-Miguel A, et al. Genomic insights on the ethno-history of the Maya and the 'Ladinos' from Guatemala. BMC Genomics. 2015;16:131. doi:10.1186/s12864-015-1339-1
- 3.Hellenthal G, Busby GBJ, Band G, et al. A genetic atlas of human admixture history. Science. 2014;343(6172):747-751. doi:10.1126/science.1243518
- 4.Adams RN. Cultural Surveys of Panama, Nicaragua, Guatemala, El Salvador, Honduras. Washington DC: Pan American Sanitary Bureau; 1957 (foundational ethnographic survey).
- 5.Comisión para el Esclarecimiento Histórico (CEH). Guatemala: Memoria del Silencio. Guatemala: CEH; 1999.
Other countries in Latin America
Aggregate phenotype references for neighbouring Latin America nations, weighted by demographic composition.
- Antigua and Barbuda
- Argentina
- Bahamas
- Barbados
- Belize
- Bolivia
- Brazil
- Chile
- Colombia
- Costa Rica
- Cuba
- Dominica
- Dominican Republic
- Ecuador
- El Salvador
- Grenada
- Guyana
- Haiti
- Honduras
- Jamaica
- Mexico
- Nicaragua
- Panama
- Paraguay
- Peru
- Puerto Rico
- Saint Kitts and Nevis
- Saint Lucia
- Saint Vincent and the Grenadines
- Suriname
- Trinidad and Tobago
- Uruguay
- Venezuela