Help us get this right
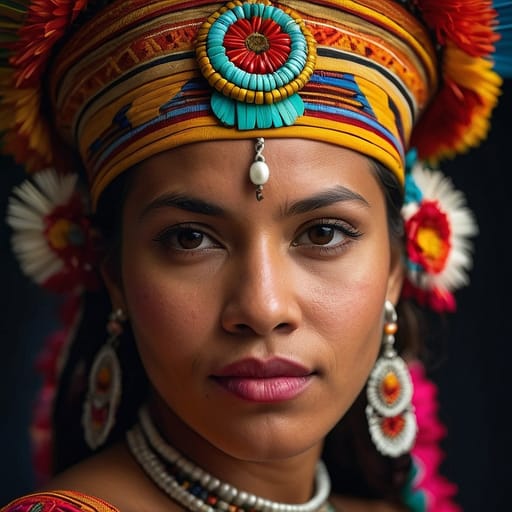
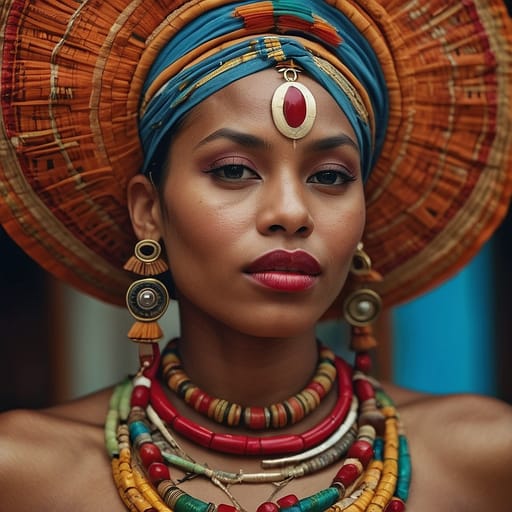
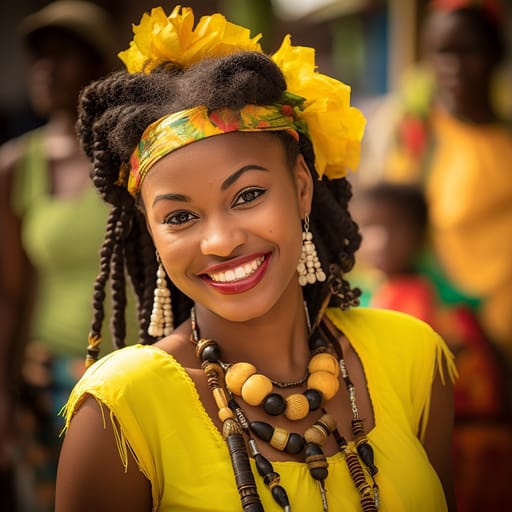
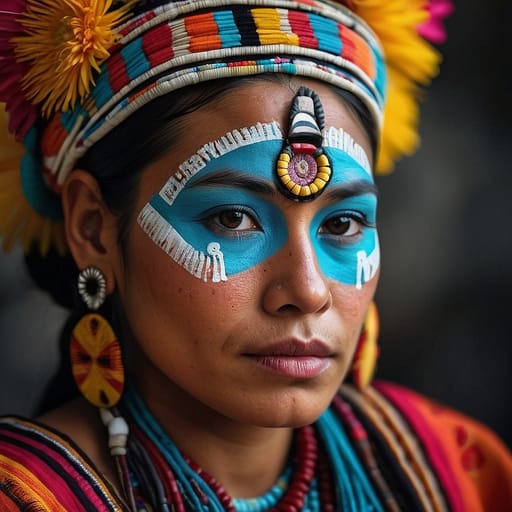
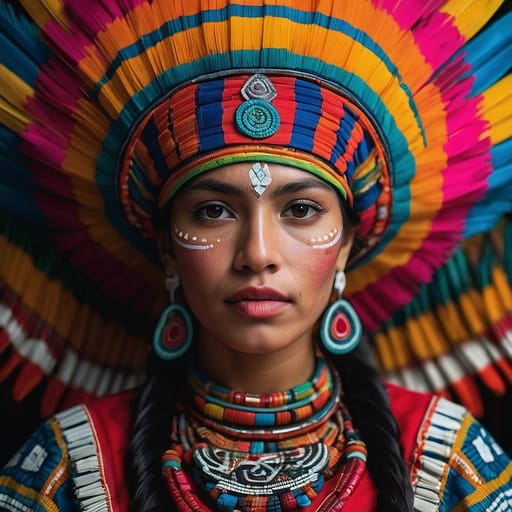
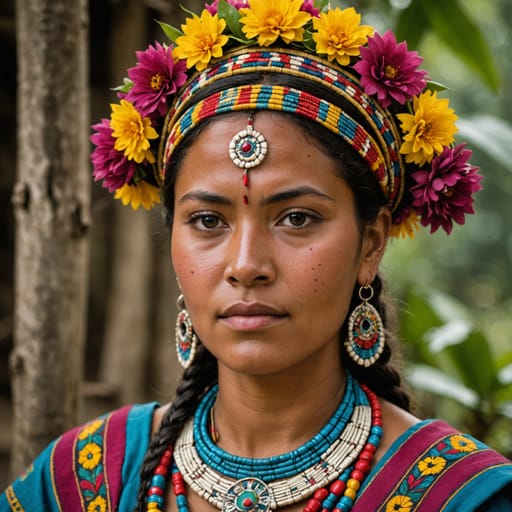
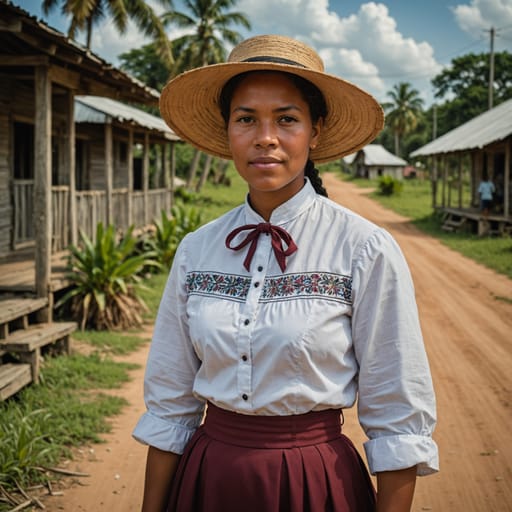
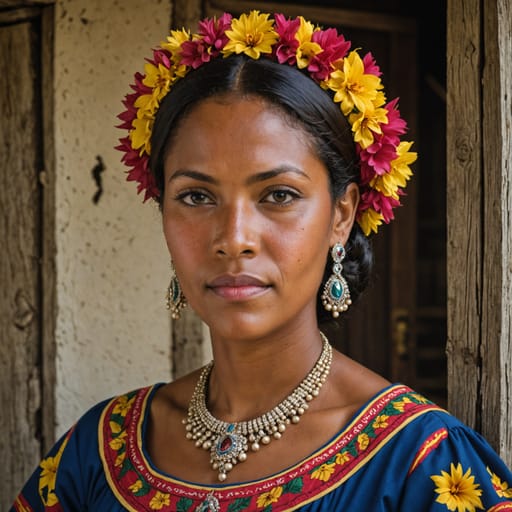
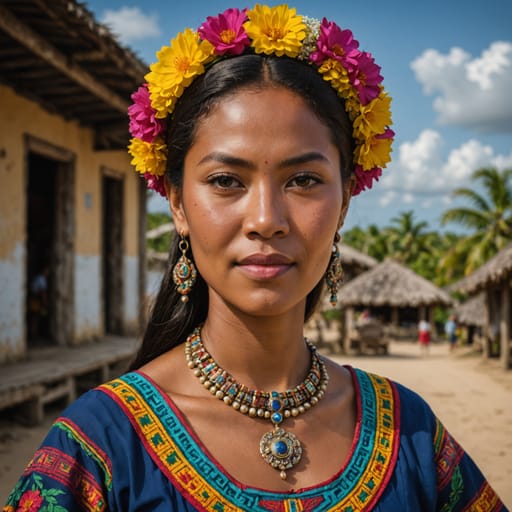
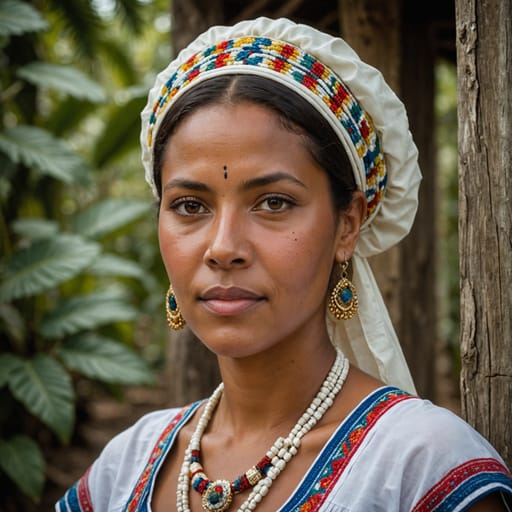
Does this portrait look right for Mestizo Belizean?
One tap. It takes a second and it is recorded.
1 says it looks right, 0 say it looks off.
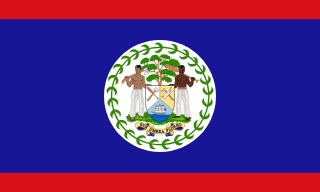

Belize
BZLatin America
Belize is home to 10 documented ethnic groups in Latin America, led by Mestizo Belizean (~51%), Creole Belizean (~26%), Garifuna (~6%), Qeqchi Maya (~6%). This page blends their phenotype and demographic data into one weighted reference: skin tone, facial features, hair texture and build, drawn from published census and ancestry sources.
Demographic Composition
Composition weights are derived from self-identification in published census and demographic surveys. Each row links to the source ethnic-group atlas page.
| Ethnic group | Weight | Source |
|---|---|---|
 Mestizo Belizean Mestizo Belizean | 51.0% | Statistical Institute of Belize 2010 Census (Belize Population and Housing Census 2010), self-identified Mestizo (~52.9% in raw census responses, normalized to 51.0% here to account for the ~5% over-100% sum produced by multi-ethnic self-identification reporting); the largest ethnic group, including descendants of 19th c. Yucatec Maya and Mestizo refugees from the Yucatán Caste War (1847-1901) plus subsequent immigration from Guatemala, Honduras, and El Salvador |
 Creole Belizean Creole Belizean | 26.0% | Statistical Institute of Belize 2010 Census, self-identified Creole (~26%); the English-Creole-speaking Afro-descendant population that emerged from the early colonial-era enslaved-African population brought during British logwood and mahogany extraction periods of the 17th-19th c. plus 19th c. liberated-African and Caribbean immigrant arrivals |
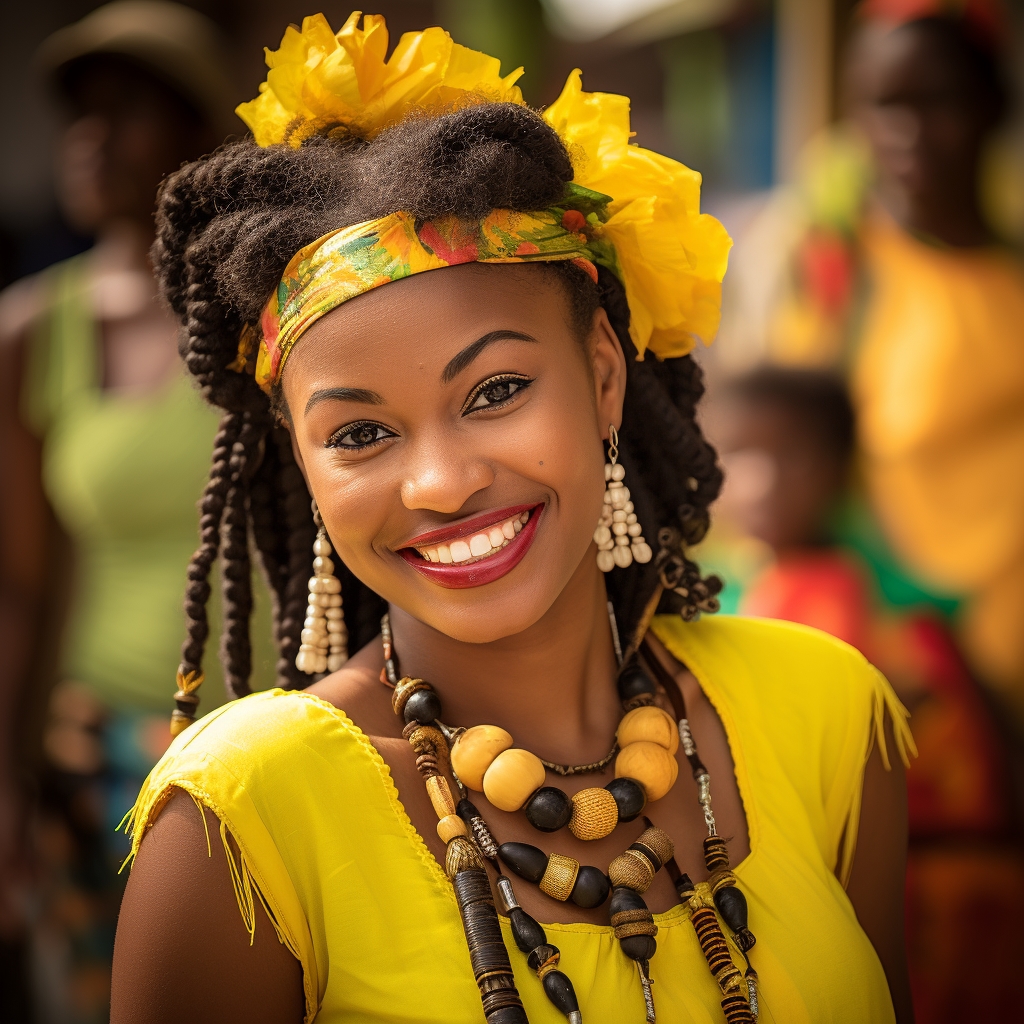 Garifuna Garifuna | 6.3% | Statistical Institute of Belize 2010 Census, self-identified Garífuna (~6.3%, ~17,000+); concentrated in the Stann Creek District (Dangriga, Hopkins, Seine Bight) and Punta Gorda. The Garífuna are the founders of the cultural-cultural foundation of the modern Garífuna communities, having been deported from Saint Vincent in 1797 |
 Qeqchi Maya Qeqchi Maya | 6.0% | Statistical Institute of Belize 2010 Census, self-identified Q'eqchi' Maya (~6.0%, ~17,000+); concentrated in southern Belize (Toledo District), the cross-border population shared with the much larger Guatemalan Q'eqchi' Maya |
 Yucatec Maya Yucatec Maya | 4.1% | Statistical Institute of Belize 2010 Census, self-identified Yucatec Maya (~4.1%); concentrated in northern Belize (Corozal, Orange Walk districts) — the cross-border population shared with the Mexican Yucatec Maya |
 Mopan Maya Mopan Maya | 3.8% | Statistical Institute of Belize 2010 Census, self-identified Mopan Maya (~3.8%, ~11,000+); concentrated in Toledo and Cayo districts in southern Belize, with smaller cross-border population in Guatemala |
 Mennonite Belizean Mennonite Belizean | 3.4% | Statistical Institute of Belize 2010 Census, self-identified Mennonite (~3.4%, ~10,000+); the German-Plautdietsch-speaking Old Colony, Kleine Gemeinde, and Evangelical Mennonite Mission Conference communities concentrated in Spanish Lookout (Cayo District), Blue Creek (Orange Walk), Shipyard (Orange Walk), and Little Belize (Corozal) |
 Other Belizean Other Belizean | 1.3% | Statistical Institute of Belize 2010 Census, residual including mixed self-identification, Hispanic non-Mestizo, and other categories not enumerated above; the official census figures sum slightly over 100% due to multi-ethnic self-identification, so this residual is calculated to bring the composition sum to ~1.0 |
 Asian Belizean Asian Belizean | 1.1% | Statistical Institute of Belize 2010 Census, self-identified East Indian (~0.6%) plus Chinese (~0.4%) plus other Asian (~0.1%); the East Indian community descends from 19th c. indentured-labor arrivals (smaller-scale than in Trinidad or Guyana but historically present); the Chinese community descends from late-19th c. and 20th-21st c. immigration |
 White Belizean White Belizean | 0.9% | Statistical Institute of Belize 2010 Census, self-identified white (~0.9%); excludes Mennonite-Belizean (separately enumerated). Includes British colonial-era settlers, US-Belizean retiree communities (especially in Cayo District), and other European immigrant populations |
Belize Phenotype Profile
Belize has the most demographically diverse population structure in Central America after Panama — and is unique among Central American countries in being the only one with English as the official language and an Anglophone-British-colonial historical-political trajectory rather than a Hispanic-Spanish-colonial one. The 2010 Statistical Institute census reports a national distribution of approximately 53% Mestizo Belizean, 26% Creole Belizean, 14% Maya (Yucatec, Q'eqchi', Mopan combined), 6.3% Garífuna, 3.4% Mennonite, 1.1% Asian, 0.9% white, and 2.4% other or mixed. The country was demographically Creole-majority through much of the colonial period; the 20th c. Mestizo demographic ascendance reflects substantial immigration from neighboring Spanish-speaking countries plus the historical Yucatán Caste War refugee inflow.
Genome-wide studies place average national ancestry at approximately 35-50% Indigenous American (with regional concentration in southern Belize Maya populations), 25-35% European (with regional concentration in Mennonite and broader white-Belizean populations), and 15-25% African (with regional concentration in Creole and Garífuna populations). The four main ecological-demographic zones each have distinctive phenotype distributions: the Belize District urban corridor (Belize City) carries Creole-majority and broader-mixed populations; northern Belize (Corozal, Orange Walk) carries Mestizo-majority populations with substantial Yucatec Maya communities; western Belize (Cayo District, including Spanish Lookout Mennonite community) carries mixed Mestizo, Mennonite, and broader populations; southern Belize (Stann Creek, Toledo) carries Garífuna coastal communities plus Q'eqchi' and Mopan Maya highland communities. Skin tone across the population spans the full Fitzpatrick range I-VI with III-V the modal range nationally — substantially broader than any other Central American national distribution. Hair texture spans the full Andre Walker range. Eye color is predominantly brown nationally with elevated light-eye frequencies in Mennonite, white-Belizean, and admixed populations.
Belize Body & Anatomy Reference
Per-feature anatomical profile for AI nude generation: South American Indigenous / European-Mestizo / Afro-Latino mix phenotype dominant in Belize
Belize Women: Boobs & Breasts
Belize women's tits and boobs reflect the medium-to-large cup, full, high projection South American Indigenous / European-Mestizo / Afro-Latino mix bust profile dominant in the Belize demographic composition. Belize nipples and areolas show medium-brown to dark-brown areolar pigmentation against the tan-to-deep-brown skin tone, with areolar diameter typically in the 32-46mm range, distinct from the the smaller bust profile of Andean Indigenous sub-populations. Belize breast morphology trends the classic Brazilian / Latina curvy bust profile in lowland populations; smaller and shorter-set in Andean Indigenous populations, a function of the endomorph-to-mesomorph with high gluteal-femoral deposition body habitus and mean adult female BMI 25-28. For anatomically-accurate AI-generated Belize nude women the render should preserve: medium-to-large cup, full, high projection shape, 32-46mm areolas with regional pigmentation, and the torso proportions of the South American Indigenous / European-Mestizo / Afro-Latino mix phenotype.
Belize Women: Ass & Hips
Belize women's ass and hip morphology presents as full, high projection, the famous Brazilian / Latina bunda profile, distinctly different from the slim narrow-hip East Asian profile. Belize pelvic profile shows wide iliac crests, very full gluteal-femoral fat deposition (the hallmark Brazilian / Latina hip-to-waist ratio), anchored in the South American Indigenous / European-Mestizo / Afro-Latino mix skeletal pattern that dominates the Belize ethnic composition. Belize butt shots in adult AI imagery should render the full, high projection, the famous Brazilian / Latina bunda profile silhouette with the endomorph-to-mesomorph with high gluteal-femoral deposition build and the gluteal-femoral fat distribution typical of the South American Indigenous / European-Mestizo / Afro-Latino mix phenotype rather than defaulting to a globally-averaged shape that generic AI generators produce.
Belize Women: Vagina & Pussy
Belize women's pussy and vulvar anatomy presents medium-brown to dark-brown labial pigmentation, fuller labia minora, consistent with the South American Indigenous / European-Mestizo / Afro-Latino mix phenotype's pigmentation pattern dominant in Belize. Belize pubic hair is typically wavy-to-curly coarse dark texture, dense distribution, distributed in the inverted-triangle pattern with regional-typical density. AI-generated Belize nude imagery should preserve the medium-brown to dark-brown labial pigmentation and the wavy-to-curly coarse dark texture hair texture rather than defaulting to a Western-European pink-and-sparse template. For anatomically-accurate Belize pussy renders the labial pigmentation should match the surrounding tan to deep-brown skin tone of the South American Indigenous / European-Mestizo / Afro-Latino mix phenotype.
Belize Men: Dicks & Penis
Belize men's dick and penile anatomy in adult AI generation should anchor on the regional reference data: regional mean ~13cm erect, moderate-to-above-average girth, and medium-brown shaft pigmentation. Belize cock profile reflects the South American Indigenous / European-Mestizo / Afro-Latino mix ancestral population's anthropometric measurements rather than a globally-averaged Western-pornography default. For anatomically-accurate Belize nude male imagery the shaft pigmentation should track the surrounding tan to deep-brown skin tone, with continuous glans-to-shaft pigmentation transition and the wavy-to-curly coarse dark texture pubic-hair texture distributed in the typical inverted-V escutcheon. Circumcision status across Belize men varies by religious and cultural tradition rather than ancestral phenotype.
Belize People: Body, Curves & Build
Belize body type and overall build presents as endomorph-to-mesomorph with high gluteal-femoral deposition, with mean adult female BMI 25-28: the characteristic South American Indigenous / European-Mestizo / Afro-Latino mix habitus dominant in the Belize demographic composition. Belize curves and proportions in adult AI imagery should preserve the regional skeletal frame (height, shoulder-to-hip ratio, limb proportions) rather than scaling to a Western-European mesomorph default. The Belize nude female form, when rendered with anatomical fidelity, shows the height range, frame width, and adipose distribution pattern typical of the South American Indigenous / European-Mestizo / Afro-Latino mix phenotype. Generic AI image generators tend to collapse regional body types into a few default shapes; the Ethnic Erotic phenotype-anchored approach preserves the Belize build as its own reference category.
Belize People: Skin Tone & Hair Texture
Belize skin tone falls in the tan to deep-brown (Fitzpatrick III-VI) band, the surface signal most often miscalibrated by generic AI nude generators trained on Western-photographic datasets. Belize hair texture is typically straight-to-curly 1A-3C, varies widely by ancestral composition, characteristic of the South American Indigenous / European-Mestizo / Afro-Latino mix phenotype. For anatomically-accurate Belize nude renders the skin should hold the Fitzpatrick band consistently across body surface rather than showing the lighter-than-face body shading that AI generators default to. Belize hair pigmentation and texture on body, pubic, and head should match across the figure rather than mixing textures (a common AI artefact).
A descriptive view, not a claim about individuals
This page shows a weighted aggregate of phenotype observations across the Belize population, based on demographic composition from published census and ancestry sources. Phenotypes within any country are far more varied than the aggregate suggests; this is a descriptive reference, not a deterministic claim about any individual. For source-level detail on individual ethnic groups, see the constituent atlas pages linked below.
Methodology Notes
Composition weights are derived from the Statistical Institute of Belize 2010 Census (Belize Population and Housing Census 2010), the most recent comprehensive Belizean census; the planned 2022 census is in process. The 2010 census enumerated self-identification across the constitutionally-recognized categories (Mestizo, Creole, Maya — with sub-group enumeration, Garífuna, Mennonite, East Indian, Chinese, white, plus other and mixed). Caveats: (1) the Mestizo / Creole boundary has shifted historically as the Mestizo population has grown through immigration and the Creole population has experienced relative demographic decline through emigration to the United States, with consequent political tensions; (2) the Mennonite community is ethnically and linguistically distinctive and is enumerated separately (one of the few national censuses to enumerate Mennonite as a distinct category); (3) the Garífuna 6.3% share is the largest national Garífuna share after Honduras; (4) the post-2010 demographic trajectory includes substantial recent immigration from Honduras, El Salvador, and Guatemala plus continuing Belize-to-United-States emigration.
Primary Sources
- 1.Statistical Institute of Belize. Belize Population and Housing Census 2010: Country Report. Belmopan: SIB; 2013.
- 2.Bolland ON. The Formation of a Colonial Society: Belize, From Conquest to Crown Colony. Baltimore: Johns Hopkins University Press; 1977.
- 3.Roessingh CH. The Belizean Garifuna: Organization of Identity in an Ethnic Community. Amsterdam: Rozenberg; 2002.
- 4.Wilk RR. Mayan People Within and Beyond Boundaries: Social Categories and Lived Identity in Yucatán. Atlantic Highlands: Humanities Press; 1991.
- 5.Roessingh CH, Plasil T. Between Horse and Buggy and Four-Wheel Drive: Change and Diversity Among Mennonite Settlements in Belize, Central America. Amsterdam: VU University Press; 2009.
Other countries in Latin America
Aggregate phenotype references for neighbouring Latin America nations, weighted by demographic composition.
- Antigua and Barbuda
- Argentina
- Bahamas
- Barbados
- Bolivia
- Brazil
- Chile
- Colombia
- Costa Rica
- Cuba
- Dominica
- Dominican Republic
- Ecuador
- El Salvador
- Grenada
- Guatemala
- Guyana
- Haiti
- Honduras
- Jamaica
- Mexico
- Nicaragua
- Panama
- Paraguay
- Peru
- Puerto Rico
- Saint Kitts and Nevis
- Saint Lucia
- Saint Vincent and the Grenadines
- Suriname
- Trinidad and Tobago
- Uruguay
- Venezuela