
Help us get this right
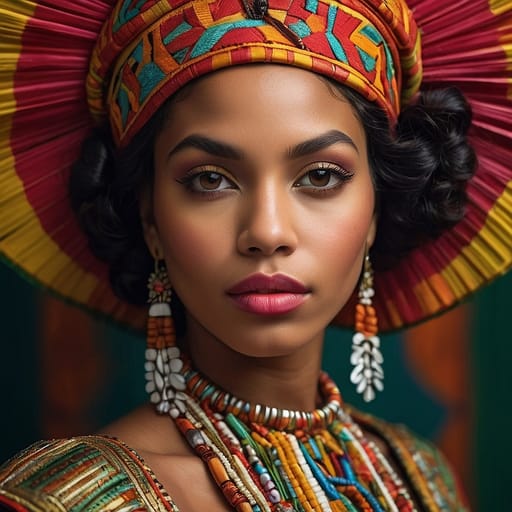
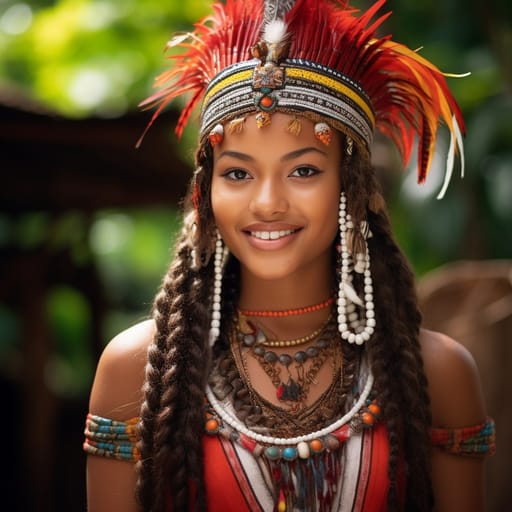
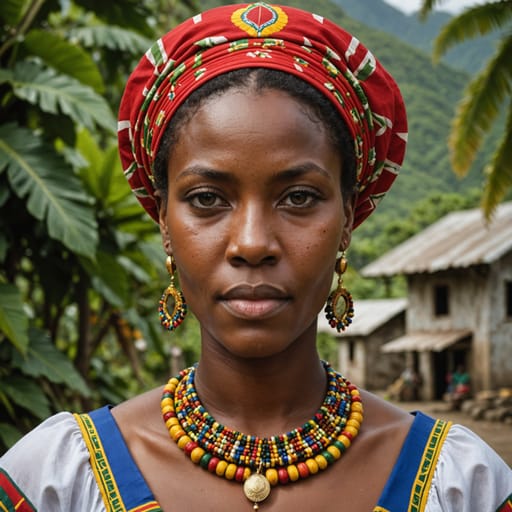
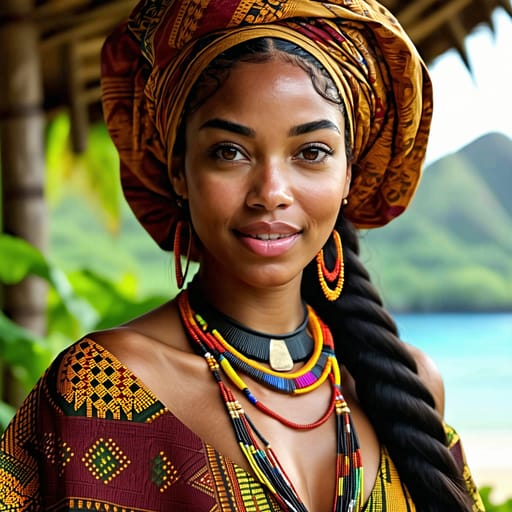
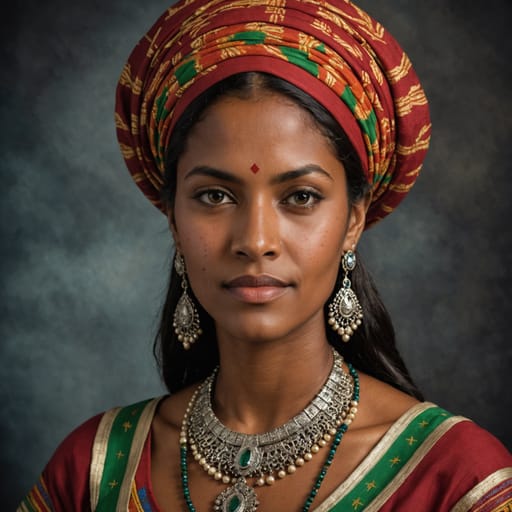
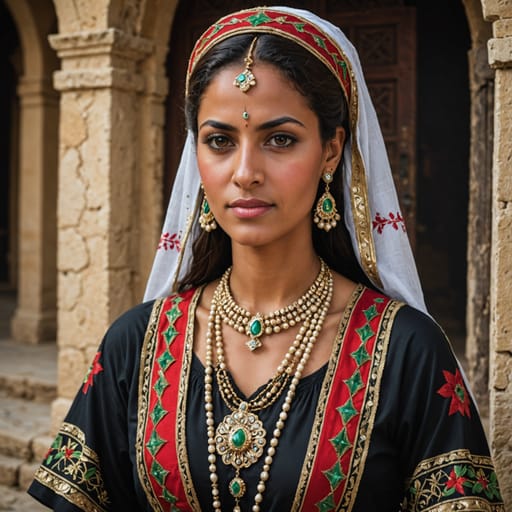
Does this portrait look right for Afro-Dominican (Caribbean)?
Nobody has judged this one yet. You would be the first.
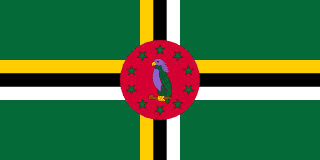

Dominica
DMLatin America
Dominica is home to 7 documented ethnic groups in Latin America, led by Afro-Dominican (Caribbean) (~86%), Mixed Dominican (Caribbean) (~8%), Kalinago (~3%), Other Dominica (~1%). This page blends their phenotype and demographic data into one weighted reference: skin tone, facial features, hair texture and build, drawn from published census and ancestry sources.
Demographic Composition
Composition weights are derived from self-identification in published census and demographic surveys. Each row links to the source ethnic-group atlas page.
| Ethnic group | Weight | Source |
|---|---|---|
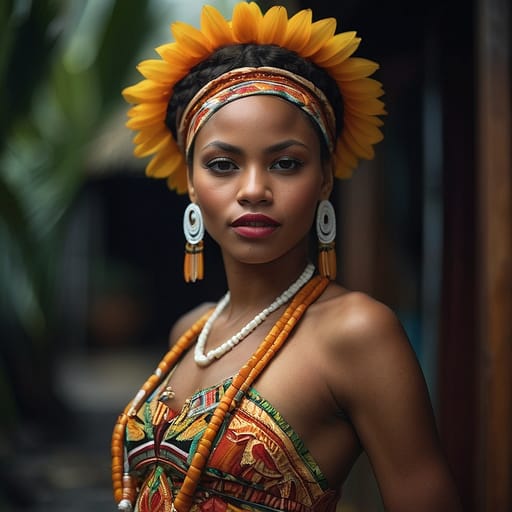 Afro-Dominican (Caribbean) Afro-Dominican (Caribbean) | 86.4% | Central Statistical Office of Dominica 2011 Census, self-identified Black/African-descended (~86.4%); descendants of enslaved Africans brought to British colonial Dominica during 18th-19th c. coffee, cocoa, and sugar economy expansion (Dominica's plantation economy was historically smaller-scale than Jamaica's or Barbados's) |
 Mixed Dominican (Caribbean) Mixed Dominican (Caribbean) | 8.2% | Central Statistical Office 2011 Census, self-identified mixed (~8.2%) |
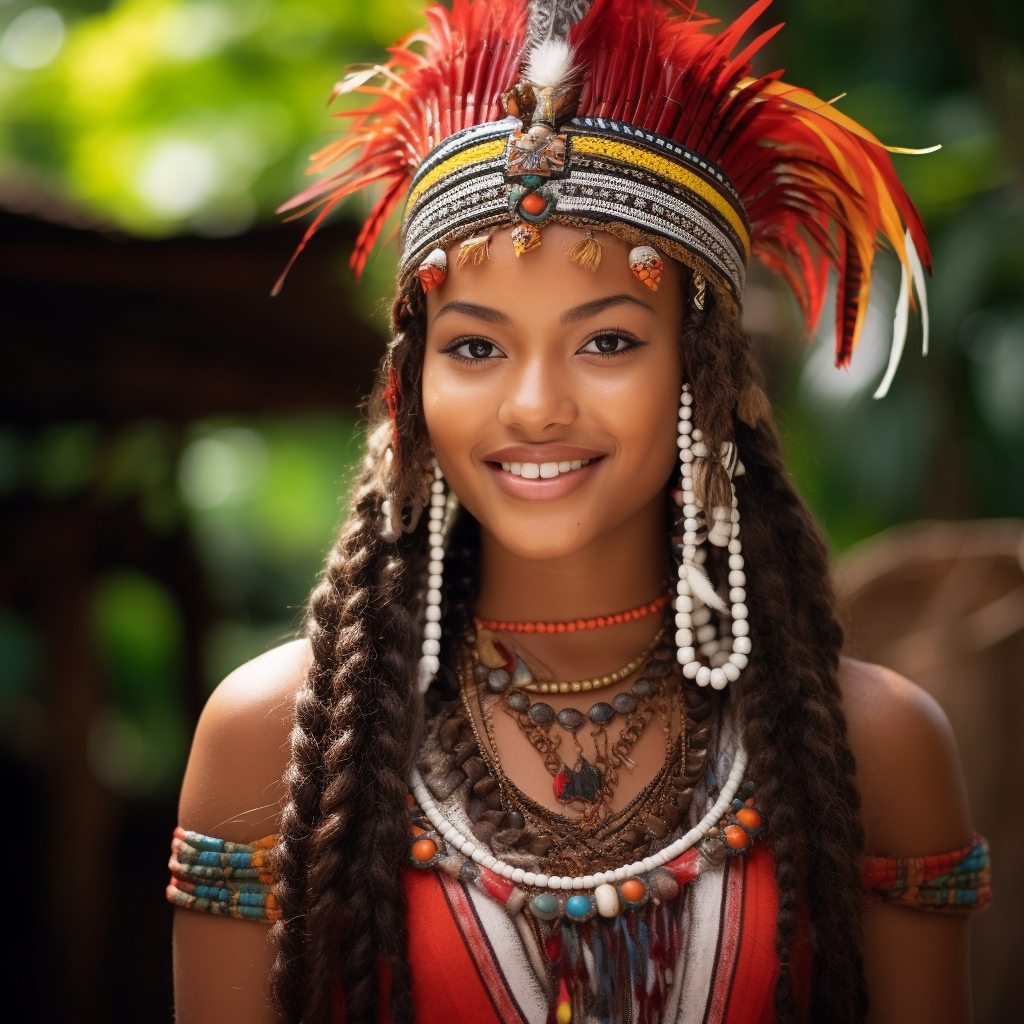 Kalinago Kalinago | 2.9% | Central Statistical Office 2011 Census, self-identified Kalinago/Carib (~2.9%, ~3,000+); the only continuously surviving Indigenous Carib population in any Caribbean country, concentrated in the Kalinago Territory (formerly the Carib Reserve, designated 1903) on the eastern coast of Dominica |
 Other Dominica Other Dominica | 0.9% | Central Statistical Office 2011 Census, residual including 'other' or no answer plus the recent economic-citizenship-program immigrant population (Dominica operates a citizenship-by-investment program that has produced demographic inflow in recent years) |
 White Dominican (Caribbean) White Dominican (Caribbean) | 0.8% | Central Statistical Office 2011 Census, self-identified white/Caucasian (~0.8%); descendants of British and French colonial-era settlers (Dominica passed between French and British control multiple times before final British acquisition in 1814) plus contemporary expat communities |
 Indo-Caribbean Immigrant Indo-Caribbean Immigrant | 0.5% | Central Statistical Office 2011 Census, self-identified East Indian (~0.5%); small community |
 Lebanese-Syrian Caribbean Lebanese-Syrian Caribbean | 0.3% | Central Statistical Office 2011 Census, self-identified Lebanese/Syrian (~0.3%) |
Dominica Phenotype Profile
Dominica has a strongly Afro-descended demographic profile (~86% Afro-Dominican Caribbean per the 2011 Central Statistical Office census), with the demographically and historically significant Kalinago Indigenous population (~2.9%) — the only continuously surviving Indigenous Carib community in any Caribbean country. Smaller mixed (~8.2%), white (~0.8%), Lebanese-Syrian (~0.3%), East Indian (~0.5%), and other (~0.9%) communities complete the structure. The country's distinctive cultural-linguistic feature is the continuing French Creole (Kwéyòl) language tradition alongside English, reflecting the pre-1814 French colonial cultural-linguistic legacy that survived British political control.
Skin tone across the population spans Fitzpatrick III-VI with V-VI the modal range nationally. Hair texture is overwhelmingly Andre Walker 4A-4C — coily — across the broader Afro-Dominican Caribbean population, with the Kalinago community showing substantial admixture-variance hair textures. Eye color is predominantly brown to dark brown nationally. The Kalinago community shows the unique phenotype-distribution characteristic of an Indigenous-Caribbean population with substantial Afro-admixture, distinct from any other contemporary national demographic profile.
Dominica Body & Anatomy Reference
Per-feature anatomical profile for AI nude generation: South American Indigenous / European-Mestizo / Afro-Latino mix phenotype dominant in Dominica
Dominica Women: Boobs & Breasts
Dominica women's tits and boobs reflect the medium-to-large cup, full, high projection South American Indigenous / European-Mestizo / Afro-Latino mix bust profile dominant in the Dominica demographic composition. Dominica nipples and areolas show medium-brown to dark-brown areolar pigmentation against the tan-to-deep-brown skin tone, with areolar diameter typically in the 32-46mm range, distinct from the the smaller bust profile of Andean Indigenous sub-populations. Dominica breast morphology trends the classic Brazilian / Latina curvy bust profile in lowland populations; smaller and shorter-set in Andean Indigenous populations, a function of the endomorph-to-mesomorph with high gluteal-femoral deposition body habitus and mean adult female BMI 25-28. For anatomically-accurate AI-generated Dominica nude women the render should preserve: medium-to-large cup, full, high projection shape, 32-46mm areolas with regional pigmentation, and the torso proportions of the South American Indigenous / European-Mestizo / Afro-Latino mix phenotype.
Dominica Women: Ass & Hips
Dominica women's ass and hip morphology presents as full, high projection, the famous Brazilian / Latina bunda profile, distinctly different from the slim narrow-hip East Asian profile. Dominica pelvic profile shows wide iliac crests, very full gluteal-femoral fat deposition (the hallmark Brazilian / Latina hip-to-waist ratio), anchored in the South American Indigenous / European-Mestizo / Afro-Latino mix skeletal pattern that dominates the Dominica ethnic composition. Dominica butt shots in adult AI imagery should render the full, high projection, the famous Brazilian / Latina bunda profile silhouette with the endomorph-to-mesomorph with high gluteal-femoral deposition build and the gluteal-femoral fat distribution typical of the South American Indigenous / European-Mestizo / Afro-Latino mix phenotype rather than defaulting to a globally-averaged shape that generic AI generators produce.
Dominica Women: Vagina & Pussy
Dominica women's pussy and vulvar anatomy presents medium-brown to dark-brown labial pigmentation, fuller labia minora, consistent with the South American Indigenous / European-Mestizo / Afro-Latino mix phenotype's pigmentation pattern dominant in Dominica. Dominica pubic hair is typically wavy-to-curly coarse dark texture, dense distribution, distributed in the inverted-triangle pattern with regional-typical density. AI-generated Dominica nude imagery should preserve the medium-brown to dark-brown labial pigmentation and the wavy-to-curly coarse dark texture hair texture rather than defaulting to a Western-European pink-and-sparse template. For anatomically-accurate Dominica pussy renders the labial pigmentation should match the surrounding tan to deep-brown skin tone of the South American Indigenous / European-Mestizo / Afro-Latino mix phenotype.
Dominica Men: Dicks & Penis
Dominica men's dick and penile anatomy in adult AI generation should anchor on the regional reference data: regional mean ~13cm erect, moderate-to-above-average girth, and medium-brown shaft pigmentation. Dominica cock profile reflects the South American Indigenous / European-Mestizo / Afro-Latino mix ancestral population's anthropometric measurements rather than a globally-averaged Western-pornography default. For anatomically-accurate Dominica nude male imagery the shaft pigmentation should track the surrounding tan to deep-brown skin tone, with continuous glans-to-shaft pigmentation transition and the wavy-to-curly coarse dark texture pubic-hair texture distributed in the typical inverted-V escutcheon. Circumcision status across Dominica men varies by religious and cultural tradition rather than ancestral phenotype.
Dominica People: Body, Curves & Build
Dominica body type and overall build presents as endomorph-to-mesomorph with high gluteal-femoral deposition, with mean adult female BMI 25-28: the characteristic South American Indigenous / European-Mestizo / Afro-Latino mix habitus dominant in the Dominica demographic composition. Dominica curves and proportions in adult AI imagery should preserve the regional skeletal frame (height, shoulder-to-hip ratio, limb proportions) rather than scaling to a Western-European mesomorph default. The Dominica nude female form, when rendered with anatomical fidelity, shows the height range, frame width, and adipose distribution pattern typical of the South American Indigenous / European-Mestizo / Afro-Latino mix phenotype. Generic AI image generators tend to collapse regional body types into a few default shapes; the Ethnic Erotic phenotype-anchored approach preserves the Dominica build as its own reference category.
Dominica People: Skin Tone & Hair Texture
Dominica skin tone falls in the tan to deep-brown (Fitzpatrick III-VI) band, the surface signal most often miscalibrated by generic AI nude generators trained on Western-photographic datasets. Dominica hair texture is typically straight-to-curly 1A-3C, varies widely by ancestral composition, characteristic of the South American Indigenous / European-Mestizo / Afro-Latino mix phenotype. For anatomically-accurate Dominica nude renders the skin should hold the Fitzpatrick band consistently across body surface rather than showing the lighter-than-face body shading that AI generators default to. Dominica hair pigmentation and texture on body, pubic, and head should match across the figure rather than mixing textures (a common AI artefact).
A descriptive view, not a claim about individuals
This page shows a weighted aggregate of phenotype observations across the Dominica population, based on demographic composition from published census and ancestry sources. Phenotypes within any country are far more varied than the aggregate suggests; this is a descriptive reference, not a deterministic claim about any individual. For source-level detail on individual ethnic groups, see the constituent atlas pages linked below.
Methodology Notes
Composition weights are derived from Dominica's 2011 Central Statistical Office Population and Housing Census, the most recent comprehensive census. Caveats: (1) the Kalinago 2.9% share is the largest national Indigenous-Carib self-identification share in the Caribbean and represents an important case of demographic continuity in a region where Indigenous populations were elsewhere eliminated; (2) the post-2017 Hurricane Maria demographic disruption produced substantial out-migration, partially captured in subsequent demographic estimates; (3) the citizenship-by-investment program has produced a small but growing demographic inflow not enumerated in 2011 data.
Primary Sources
- 1.Central Statistical Office of Dominica. Population and Housing Census 2011: General Report. Roseau: CSO; 2014.
- 2.Honychurch L. The Dominica Story: A History of the Island. London: Macmillan Caribbean; 1995.
- 3.Hulme P, Whitehead NL (eds). Wild Majesty: Encounters with Caribs from Columbus to the Present Day, an Anthology. Oxford: Oxford University Press; 1992.
- 4.Owen N, Sutty L. Wood-Carving Traditions in Dominica's Carib Reserve. Caribbean Quarterly. 1985;31(2):48-61.
- 5.Boucher P. Cannibal Encounters: Europeans and Island Caribs, 1492-1763. Baltimore: Johns Hopkins University Press; 1992.
Other countries in Latin America
Aggregate phenotype references for neighbouring Latin America nations, weighted by demographic composition.
- Antigua and Barbuda
- Argentina
- Bahamas
- Barbados
- Belize
- Bolivia
- Brazil
- Chile
- Colombia
- Costa Rica
- Cuba
- Dominican Republic
- Ecuador
- El Salvador
- Grenada
- Guatemala
- Guyana
- Haiti
- Honduras
- Jamaica
- Mexico
- Nicaragua
- Panama
- Paraguay
- Peru
- Puerto Rico
- Saint Kitts and Nevis
- Saint Lucia
- Saint Vincent and the Grenadines
- Suriname
- Trinidad and Tobago
- Uruguay
- Venezuela