


Mexico
MXLatin America
Mexico is home to 11 documented ethnic groups in Latin America — led by Mestizo Mexican (~82%), Nahuas (~6%), Yucatec Maya (~3%), Afro-Mexican (~2%). This page blends their phenotype and demographic data into one weighted reference: skin tone, facial features, hair texture and build, drawn from published census and ancestry sources.
Demographic Composition
Composition weights are derived from self-identification in published census and demographic surveys. Each row links to the source ethnic-group atlas page.
| Ethnic group | Weight | Source |
|---|---|---|
 Mestizo Mexican Mestizo Mexican | 82.3% | INEGI 2020 Census, self-identified non-indigenous + non-Afro-descendant population (~80%); supplemented by Moreno-Estrada 2014 Mexican-genome reference panel showing the dominant population carries average ~62% Native American + ~32% European + ~3.5% African admixture |
 Nahuas Nahuas | 6.3% | INEGI 2020, Nahuatl-speaking + Nahua self-identifying population (~2.5M, the largest indigenous group in Mexico) |
 Yucatec Maya Yucatec Maya | 2.6% | INEGI 2020, Yucatec Maya speakers and self-identifiers in Yucatán, Quintana Roo, Campeche (~860K) |
 Afro-Mexican Afro-Mexican | 2.1% | INEGI 2020 Census, Afro-Mexican / Afro-descendant self-identification, first measured in 2015 and incorporated into the 2020 census (~2.0%, primarily Costa Chica region of Guerrero/Oaxaca and Veracruz) |
 Mixtec Mixtec | 1.6% | INEGI 2020, Mixtec speakers and self-identifiers, primarily Oaxaca, Guerrero, Puebla (~520K) |
 Zapotecs Zapotecs | 1.6% | INEGI 2020, Zapotec speakers and self-identifiers, primarily Oaxaca (~490K) |
 Otomi Otomi | 1.4% | INEGI 2020, Otomi (Hñähñu) speakers and self-identifiers, primarily Hidalgo, México State, Querétaro (~300K) |
 Spanish-Mexican Spanish-Mexican | 1.1% | Estimated from INEGI 2020 self-identified European-descent population (small) + historical immigration records of Spanish-origin families that retain distinct cultural identity. Note: this is the SELF-IDENTIFIED European-descended population, NOT the genetic-European-admixture share of the broader Mestizo population. |
 Mazahua Mazahua | 0.5% | INEGI 2020, Mazahua speakers and self-identifiers, primarily México State and Michoacán (~150K) |
 Mazatec Mazatec | 0.4% | INEGI 2020, Mazatec speakers and self-identifiers, primarily Oaxaca and Puebla (~240K aggregate, weighted down for the named-group aggregate) |
 Mixe Mixe | 0.3% | INEGI 2020, Mixe speakers and self-identifiers, primarily Oaxaca (~140K) |
Mexico Phenotype Profile
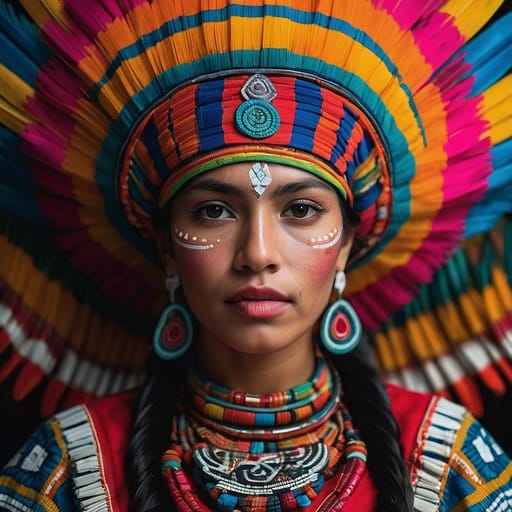
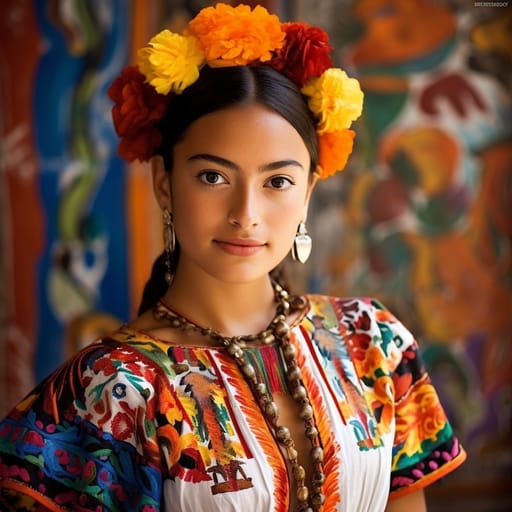
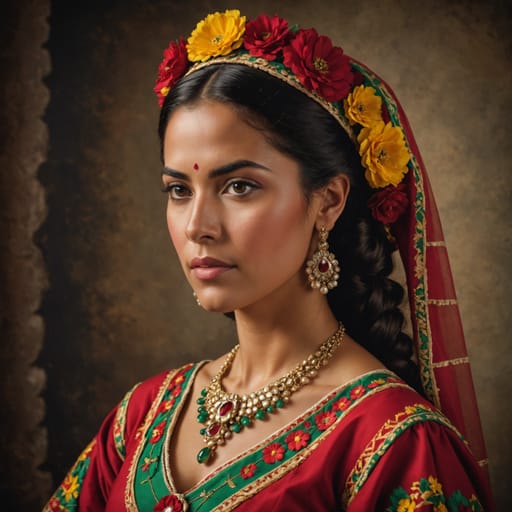
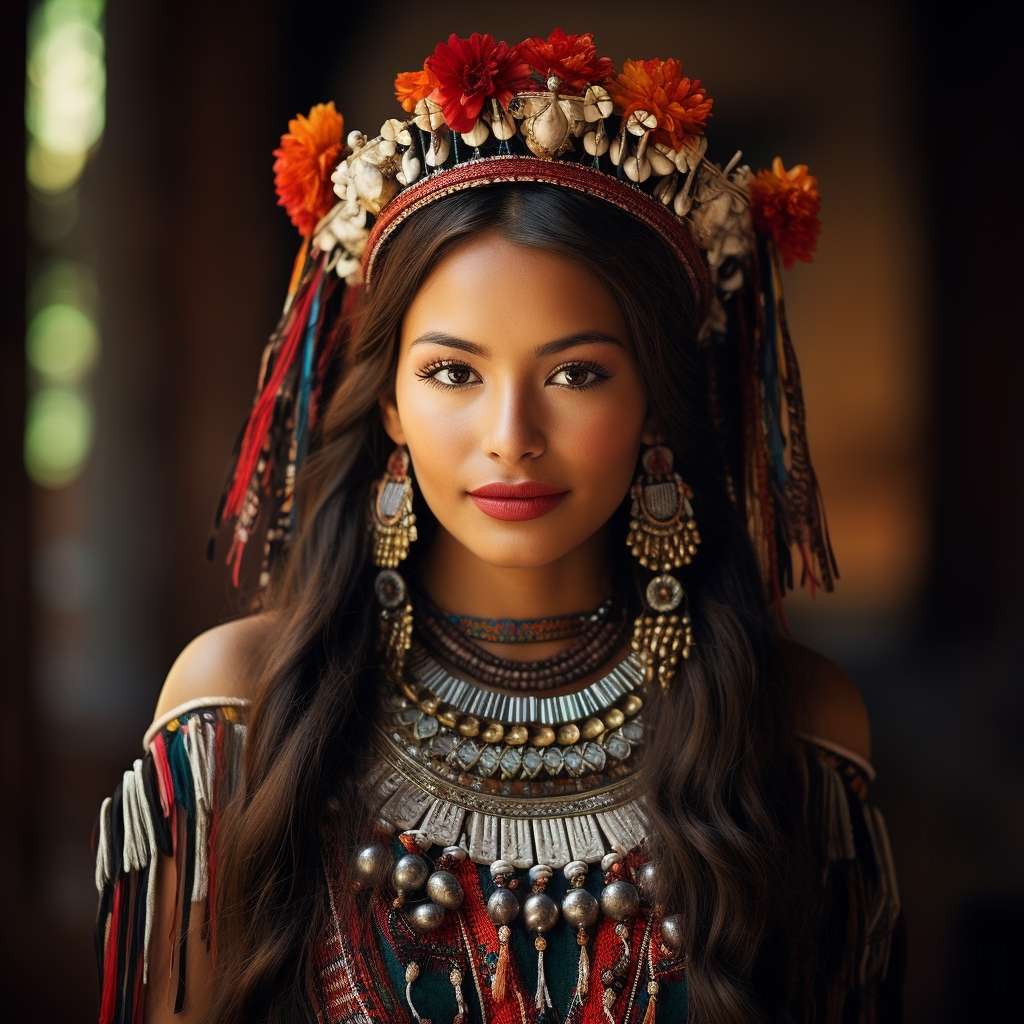
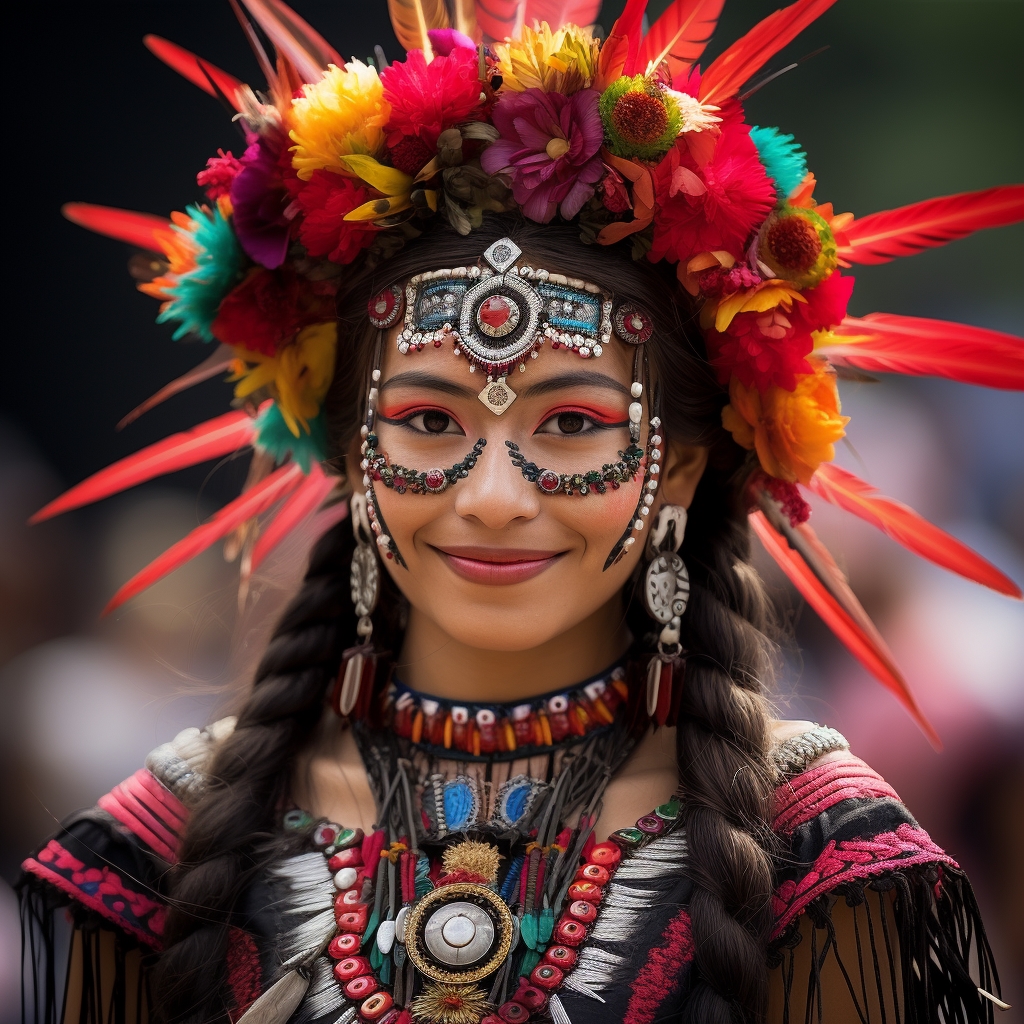
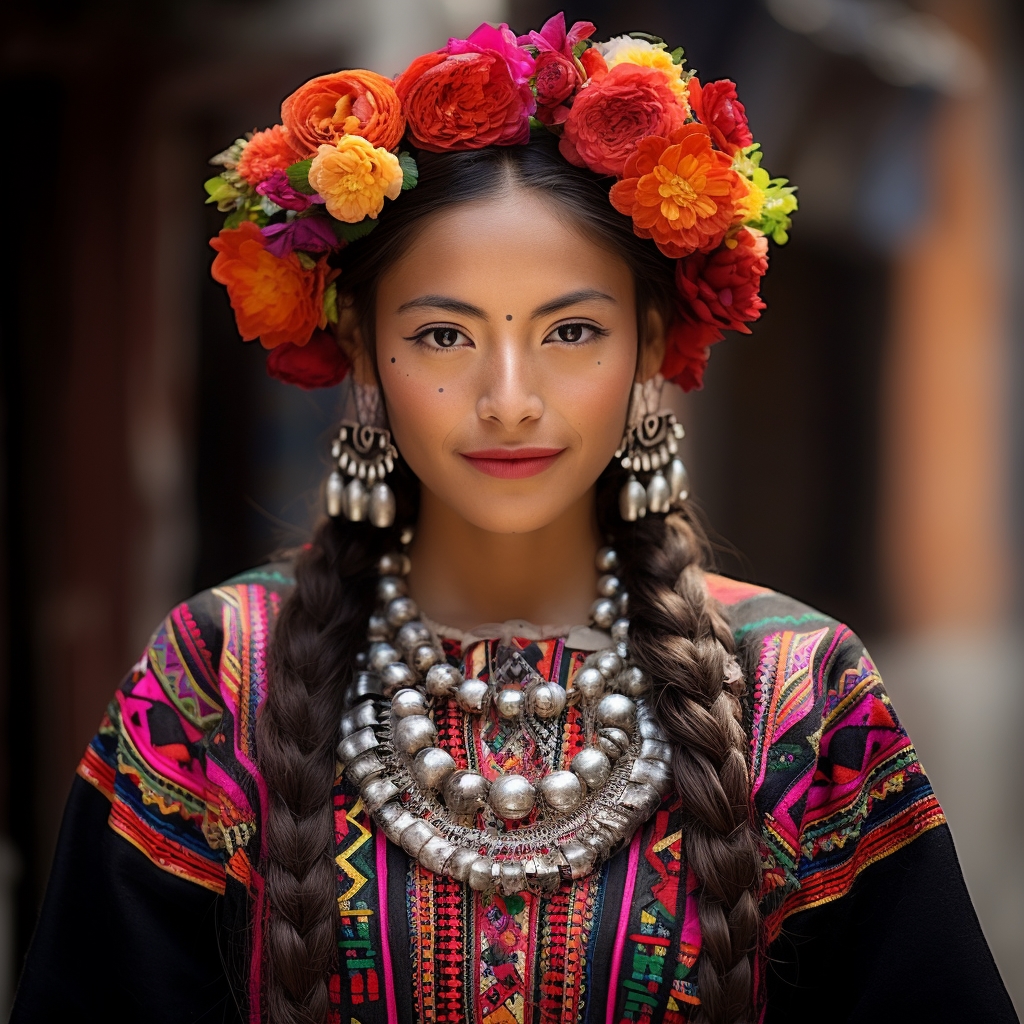
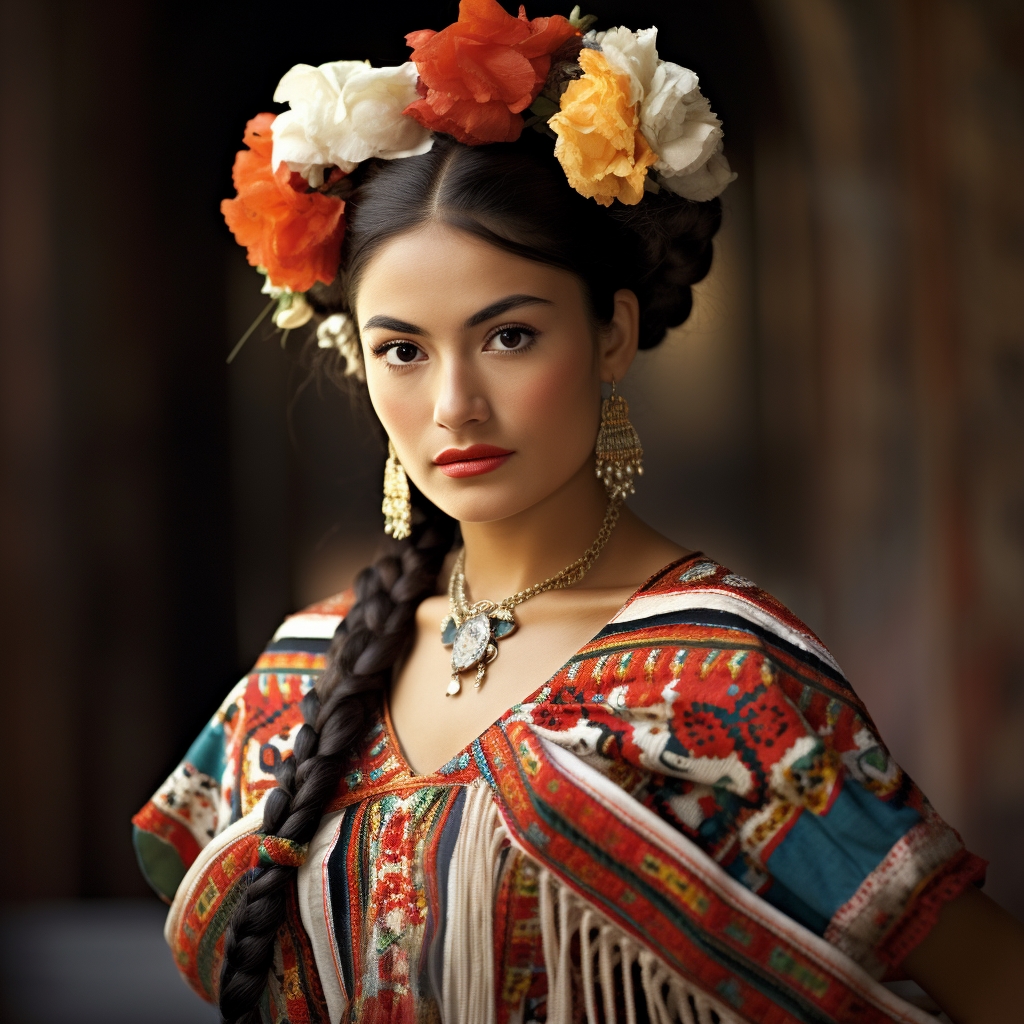
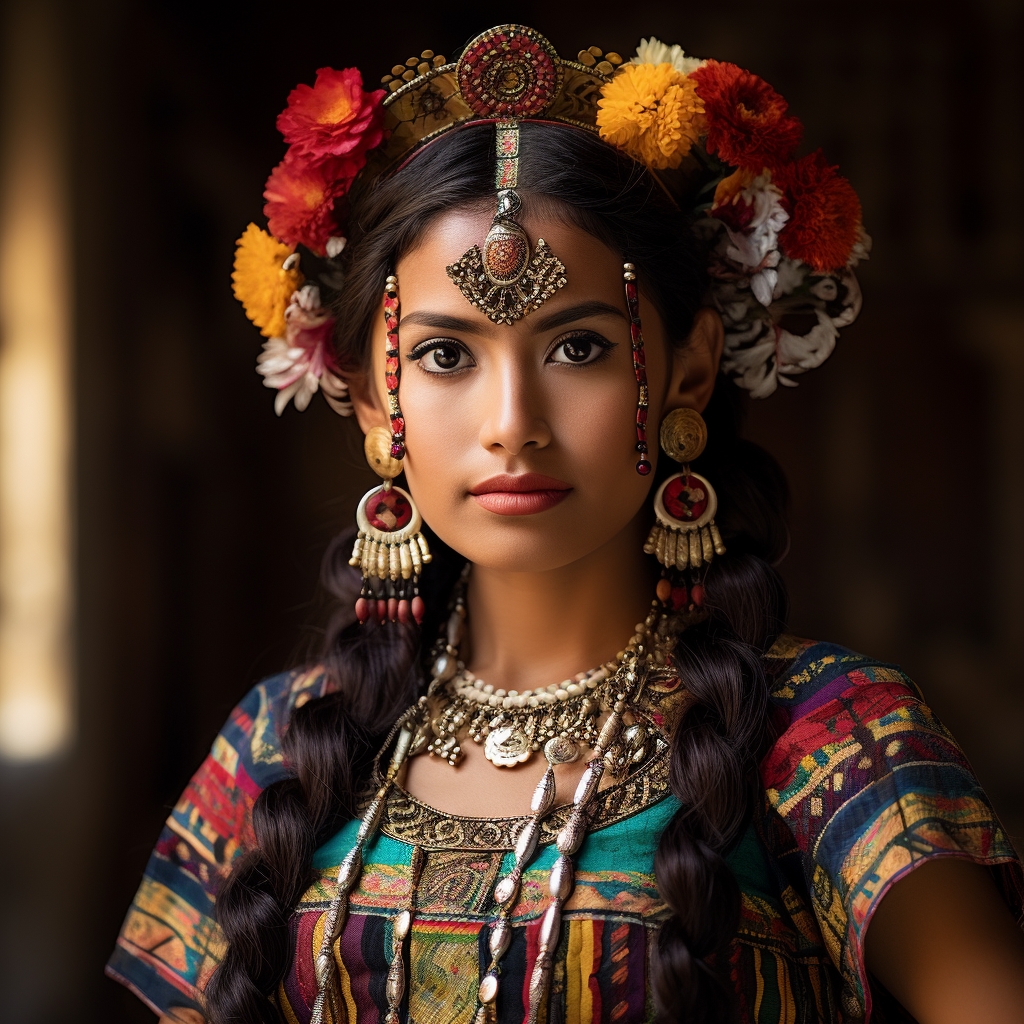
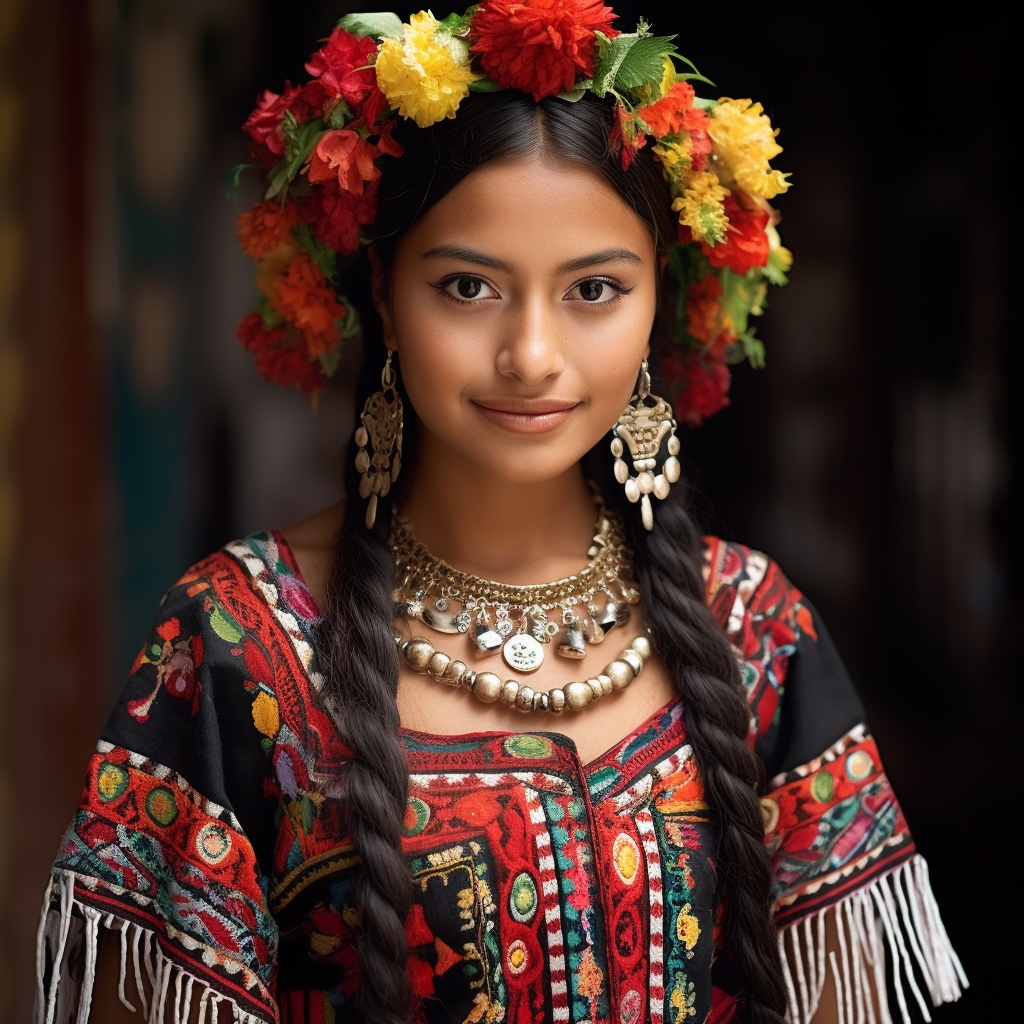
Mexico's population presents one of the most internally diverse phenotype distributions in Latin America, reflecting the country's status as a long-standing zone of admixture between indigenous Mesoamerican peoples (Nahua, Maya, Zapotec, Mixtec, Otomi, and dozens of smaller groups), Spanish and other European settlers, and African populations brought during the colonial period. The dominant Mestizo population carries average ancestry of roughly 62% Native American, 32% European, and 3.5% African per genome-wide studies, but self-identification, regional concentration, and individual variance all produce a much wider phenotypic range than the genome-wide average suggests.
Skin tone across the population spans the full Fitzpatrick range from II (in northern Mexico and self-identified European-descended communities) through V (in indigenous-majority communities and parts of the Costa Chica), with Fitzpatrick III–IV the modal range. Northern Mexican states (Sonora, Chihuahua, Nuevo León) trend toward lighter modal skin tones with higher European-admixture proportions; southern states (Oaxaca, Chiapas, Yucatán) trend toward Fitzpatrick IV–V with higher Indigenous-ancestry proportions; and the Costa Chica coastal region of Guerrero and Oaxaca contains Mexico's most concentrated Afro-Mexican phenotype distribution, with Fitzpatrick V–VI common. Hair is overwhelmingly dark brown to black with straight to wavy texture in indigenous and Mestizo populations (Andre Walker 1A–2B), curly to coily in Afro-Mexican populations (3A–4C), and with naturally lighter shades concentrated in self-identified European-descended families. Eye color is predominantly brown across the population, with a higher frequency of light-eye variants in Spanish-Mexican and northern-Mexican populations than the national average. Facial features and build show similar regional patterning, with Mesoamerican-indigenous features (epicanthic folds, broader nasal bases, prominent cheekbones, shorter average stature) concentrated in southern and rural-indigenous communities, and European-ancestry features (narrower nasal bridges, taller stature, oval-to-rectangular face shapes) concentrated in northern and urban-Mestizo communities. Internal variance within every region is high — the country's regional and individual diversity exceeds what any aggregate description can fully capture.
Mexico Body & Anatomy Reference
Per-feature anatomical profile for AI nude generation — South American Indigenous / European-Mestizo / Afro-Latino mix phenotype dominant in Mexico
Mexico Women — Boobs & Breasts
Mexico women's tits and boobs reflect the medium-to-large cup, full, high projection South American Indigenous / European-Mestizo / Afro-Latino mix bust profile dominant in the Mexico demographic composition. Mexico nipples and areolas show medium-brown to dark-brown areolar pigmentation against the tan-to-deep-brown skin tone, with areolar diameter typically in the 32-46mm range — distinct from the the smaller bust profile of Andean Indigenous sub-populations. Mexico breast morphology trends the classic Brazilian / Latina curvy bust profile in lowland populations; smaller and shorter-set in Andean Indigenous populations, a function of the endomorph-to-mesomorph with high gluteal-femoral deposition body habitus and mean adult female BMI 25-28. For anatomically-accurate AI-generated Mexico nude women the render should preserve: medium-to-large cup, full, high projection shape, 32-46mm areolas with regional pigmentation, and the torso proportions of the South American Indigenous / European-Mestizo / Afro-Latino mix phenotype.
Mexico Women — Ass & Hips
Mexico women's ass and hip morphology presents as full, high projection, the famous Brazilian / Latina bunda profile — distinctly different from the slim narrow-hip East Asian profile. Mexico pelvic profile shows wide iliac crests, very full gluteal-femoral fat deposition (the hallmark Brazilian / Latina hip-to-waist ratio), anchored in the South American Indigenous / European-Mestizo / Afro-Latino mix skeletal pattern that dominates the Mexico ethnic composition. Mexico butt shots in adult AI imagery should render the full, high projection, the famous Brazilian / Latina bunda profile silhouette with the endomorph-to-mesomorph with high gluteal-femoral deposition build and the gluteal-femoral fat distribution typical of the South American Indigenous / European-Mestizo / Afro-Latino mix phenotype rather than defaulting to a globally-averaged shape that generic AI generators produce.
Mexico Women — Vagina & Pussy
Mexico women's pussy and vulvar anatomy presents medium-brown to dark-brown labial pigmentation, fuller labia minora — consistent with the South American Indigenous / European-Mestizo / Afro-Latino mix phenotype's pigmentation pattern dominant in Mexico. Mexico pubic hair is typically wavy-to-curly coarse dark texture, dense distribution, distributed in the inverted-triangle pattern with regional-typical density. AI-generated Mexico nude imagery should preserve the medium-brown to dark-brown labial pigmentation and the wavy-to-curly coarse dark texture hair texture rather than defaulting to a Western-European pink-and-sparse template. For anatomically-accurate Mexico pussy renders the labial pigmentation should match the surrounding tan to deep-brown skin tone of the South American Indigenous / European-Mestizo / Afro-Latino mix phenotype.
Mexico Men — Dicks & Penis
Mexico men's dick and penile anatomy in adult AI generation should anchor on the regional reference data: regional mean ~13cm erect, moderate-to-above-average girth, and medium-brown shaft pigmentation. Mexico cock profile reflects the South American Indigenous / European-Mestizo / Afro-Latino mix ancestral population's anthropometric measurements rather than a globally-averaged Western-pornography default. For anatomically-accurate Mexico nude male imagery the shaft pigmentation should track the surrounding tan to deep-brown skin tone, with continuous glans-to-shaft pigmentation transition and the wavy-to-curly coarse dark texture pubic-hair texture distributed in the typical inverted-V escutcheon. Circumcision status across Mexico men varies by religious and cultural tradition rather than ancestral phenotype.
Mexico People — Body, Curves & Build
Mexico body type and overall build presents as endomorph-to-mesomorph with high gluteal-femoral deposition, with mean adult female BMI 25-28 — the characteristic South American Indigenous / European-Mestizo / Afro-Latino mix habitus dominant in the Mexico demographic composition. Mexico curves and proportions in adult AI imagery should preserve the regional skeletal frame (height, shoulder-to-hip ratio, limb proportions) rather than scaling to a Western-European mesomorph default. The Mexico nude female form, when rendered with anatomical fidelity, shows the height range, frame width, and adipose distribution pattern typical of the South American Indigenous / European-Mestizo / Afro-Latino mix phenotype. Generic AI image generators tend to collapse regional body types into a few default shapes; the EthnicErotic phenotype-anchored approach preserves the Mexico build as its own reference category.
Mexico People — Skin Tone & Hair Texture
Mexico skin tone falls in the tan to deep-brown (Fitzpatrick III-VI) band — the surface signal most often miscalibrated by generic AI nude generators trained on Western-photographic datasets. Mexico hair texture is typically straight-to-curly 1A-3C, varies widely by ancestral composition, characteristic of the South American Indigenous / European-Mestizo / Afro-Latino mix phenotype. For anatomically-accurate Mexico nude renders the skin should hold the Fitzpatrick band consistently across body surface rather than showing the lighter-than-face body shading that AI generators default to. Mexico hair pigmentation and texture on body, pubic, and head should match across the figure rather than mixing textures (a common AI artefact).
A descriptive view, not a claim about individuals
This page shows a weighted aggregate of phenotype observations across the Mexico population, based on demographic composition from published census and ancestry sources. Phenotypes within any country are far more varied than the aggregate suggests; this is a descriptive reference, not a deterministic claim about any individual. For source-level detail on individual ethnic groups, see the constituent atlas pages linked below.
Mexico in the History of Erotic Depiction
Manuals, literature & art traditions of this country · full timeline →
West Mexican shaft-tomb ceramics
artWest Mexican (shaft-tomb cultures) · c. 300 BCE-500 CE
The dominant genre is the static joined couple — companionate ancestor pairs encoding marriage and lineage rather than coital position; explicit content skews toward single-figure autoeroticism.
- Joined Couple, Proctor Stafford Collection — LACMA (M.86.296.14)
- "Pair of Figure Vessels," attrib. El Chanal — Metropolitan Museum of Art (1993.16.1, .2)
- Pair of Figures — Metropolitan Museum of Art (1978.412.156); Iztlán del Río findspot
- Seated Couple — Brooklyn Museum (2010.23.1)
- + 4 more on the timeline
Methodology Notes
Composition weights are grounded primarily in the INEGI 2020 Census (Censo de Población y Vivienda 2020), which reports self-identified indigenous (~19.4% of population aged 3+), Afro-Mexican (~2.0%), and the residual default-Mexican / Mestizo (~78.6%) populations. Per-indigenous-group weights are derived from INEGI's enumeration of indigenous-language speakers cross-referenced with self-identification. Genetic-ancestry context (Moreno-Estrada et al. 2014) is cited for phenotype interpretation but is NOT used as the weighting basis — the catalog weights self-identification (the population's own classification) rather than genome-wide admixture (a different, often-conflicting measure). Caveats: (1) the named-groups composition captures ~95% of the population; smaller indigenous groups not enumerated here appear individually at /ethnic/[slug]; (2) urban/rural distribution is uneven — the weights are national, not regional, and rural Oaxaca or Chiapas would show very different proportions; (3) self-identification has known social-desirability bias, particularly in undercounting indigenous identity in northern states.
Primary Sources
- 1.Instituto Nacional de Estadística y Geografía (INEGI). Censo de Población y Vivienda 2020. Aguascalientes: INEGI; 2021. Available at https://www.inegi.org.mx/programas/ccpv/2020/
- 2.Moreno-Estrada A, Gignoux CR, Fernández-López JC, et al. The genetics of Mexico recapitulates Native American substructure and affects biomedical traits. Science. 2014;344(6189):1280-1285. doi:10.1126/science.1251688
- 3.Bonfil Batalla G. México Profundo: Reclaiming a Civilization. Austin: University of Texas Press; 1996. Translation of México Profundo: Una Civilización Negada (1987).
- 4.Velázquez M E, Iturralde Nieto G. Afrodescendientes en México: Una historia de silencio y discriminación. México: CONAPRED / INAH; 2016.
- 5.Bryc K, Velez C, Karafet T, et al. Genome-wide patterns of population structure and admixture among Hispanic/Latino populations. Proc Natl Acad Sci USA. 2010;107(Suppl 2):8954-8961. doi:10.1073/pnas.0914618107
Other countries in Latin America
Aggregate phenotype references for neighbouring Latin America nations, weighted by demographic composition.
- Antigua and Barbuda
- Argentina
- Bahamas
- Barbados
- Belize
- Bolivia
- Brazil
- Chile
- Colombia
- Costa Rica
- Cuba
- Dominica
- Dominican Republic
- Ecuador
- El Salvador
- Grenada
- Guatemala
- Guyana
- Haiti
- Honduras
- Jamaica
- Nicaragua
- Panama
- Paraguay
- Peru
- Puerto Rico
- Saint Kitts and Nevis
- Saint Lucia
- Saint Vincent and the Grenadines
- Suriname
- Trinidad and Tobago
- Uruguay
- Venezuela