Help us get this right
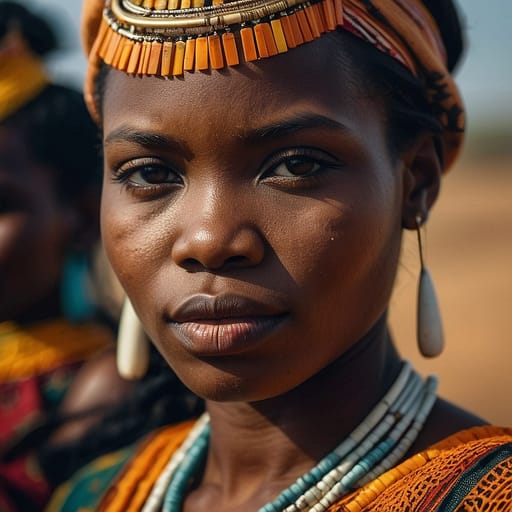
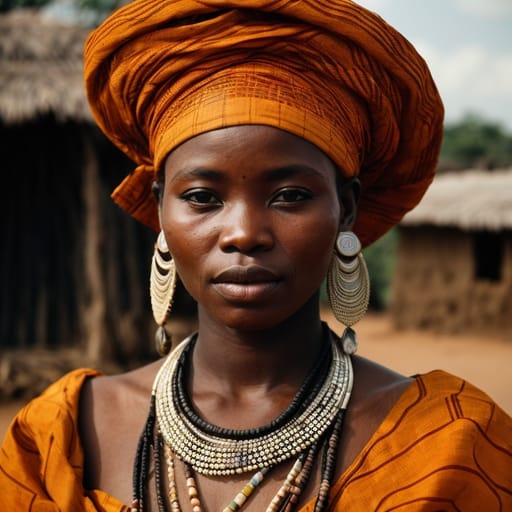
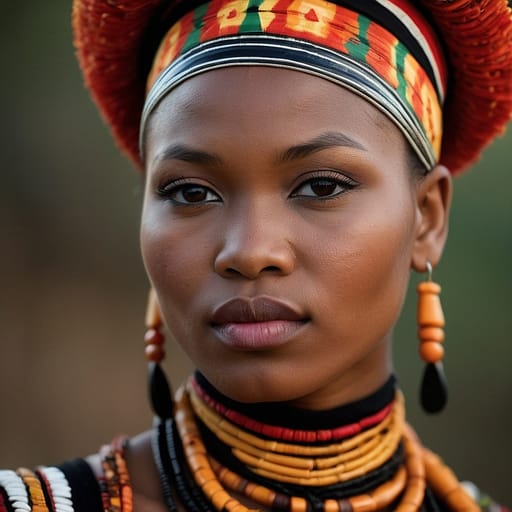
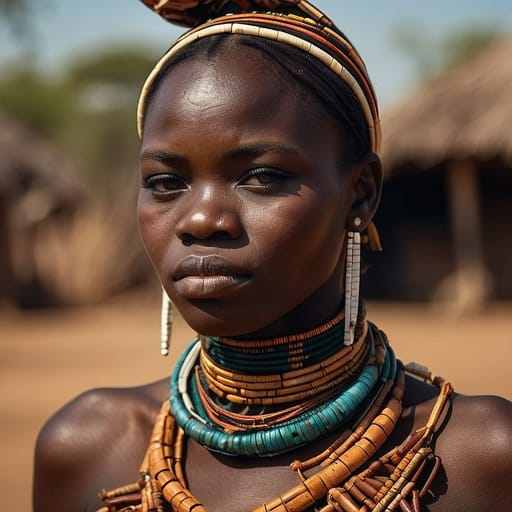
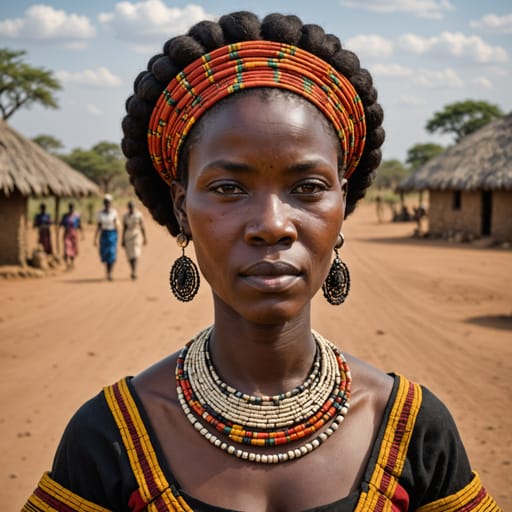
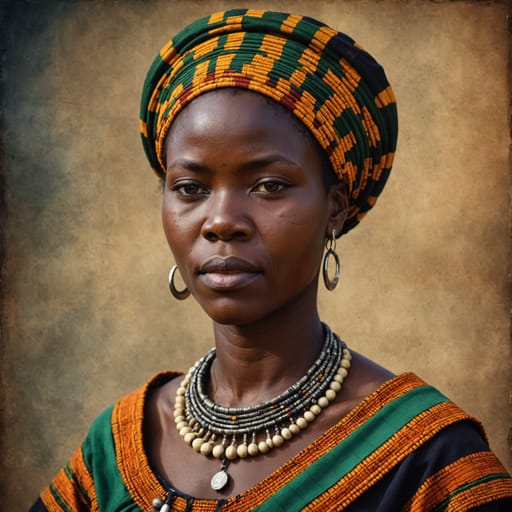
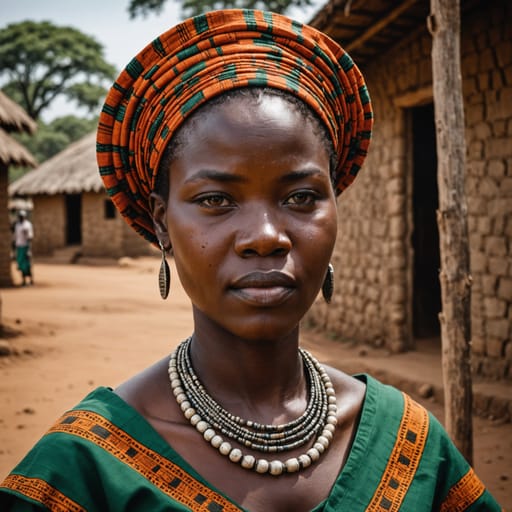
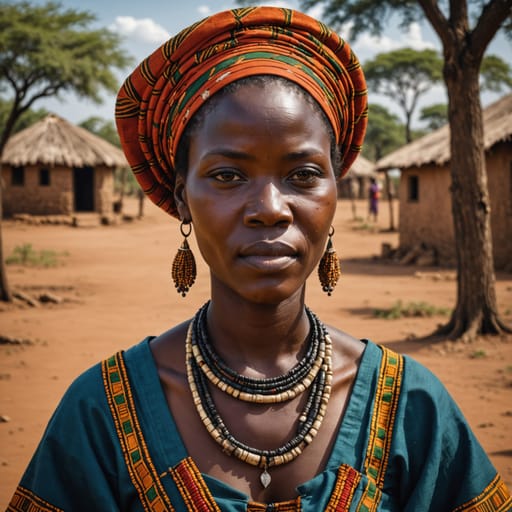
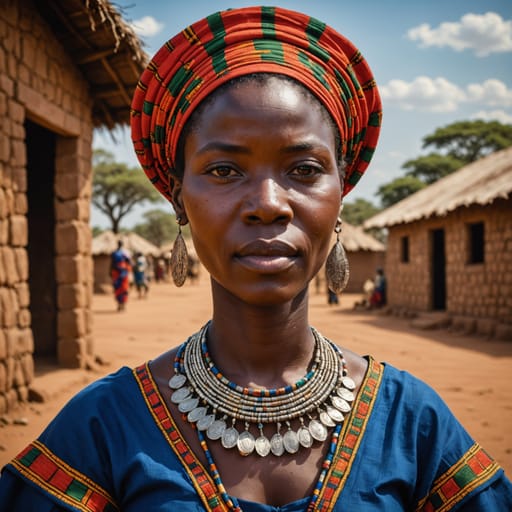
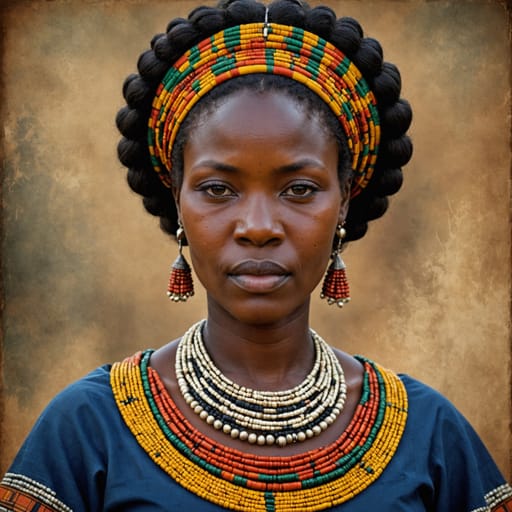
Does this portrait look right for Zambia Other?
One tap. It takes a second and it is recorded.
1 says it looks right, 0 say it looks off.
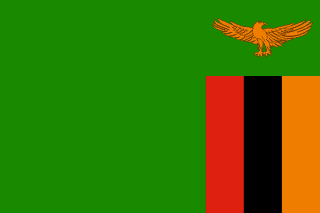

Zambia
ZMSouthern Africa
Zambia is home to 12 documented ethnic groups in Southern Africa, led by Zambia Other (~27%), Bemba (~21%), Tonga Zambia (~14%), Chewa Zambia (~7%). This page blends their phenotype and demographic data into one weighted reference: skin tone, facial features, hair texture and build, drawn from published census and ancestry sources.
Demographic Composition
Composition weights are derived from self-identification in published census and demographic surveys. Each row links to the source ethnic-group atlas page.
| Ethnic group | Weight | Source |
|---|---|---|
 Zambia Other Zambia Other | 26.9% | Zambia 2022 Census residual; includes Mbunda, Lamba, Ila, Bisa, plus white-Zambian (~40,000+) and Indian-Zambian smaller groups |
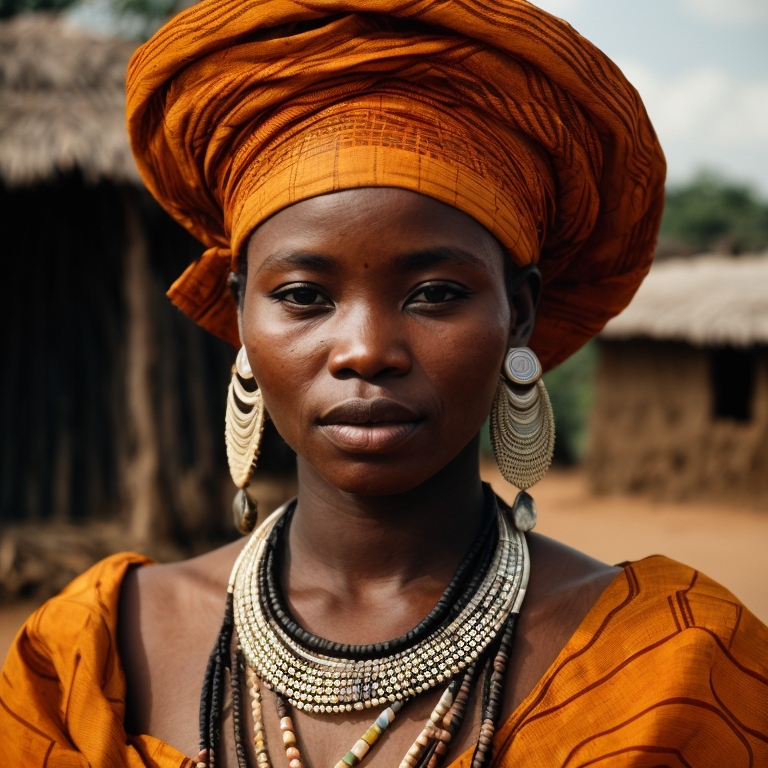 Bemba Bemba | 21.0% | Zambia 2022 Census; Bemba (~21%, ~4.4M+ of ~21M+ total). Bantu source population, predominantly Northern, Luapula, Muchinga, and Copperbelt provinces. The largest single ethnic group |
 Tonga Zambia Tonga Zambia | 14.0% | Zambia 2022 Census; Tonga (~14%); Bantu source population, predominantly Southern Province along the Zambezi valley. Cross-border with Zimbabwean Tonga |
 Chewa Zambia Chewa Zambia | 7.3% | Zambia 2022 Census; Chewa (~7.3%); cross-border with Malawian and Mozambican Chewa |
 Lozi Lozi | 5.8% | Zambia 2022 Census; Lozi (~5.8%); Bantu source population, predominantly Western Province. Founders of the historic Lozi Kingdom of Barotseland |
 Nsenga Nsenga | 5.7% | Zambia 2022 Census; Nsenga (~5.7%) |
 Tumbuka Zambia Tumbuka Zambia | 4.4% | Zambia 2022 Census; Tumbuka (~4.4%); cross-border with Malawian Tumbuka |
 Ngoni Zambia Ngoni Zambia | 4.0% | Zambia 2022 Census; Ngoni (~4%); descended from the 19th c. mfecane-period Nguni migration from Zululand |
 Lala Lala | 3.0% | Zambia 2022 Census; Lala (~3%) |
 Kaonde Kaonde | 2.9% | Zambia 2022 Census; Kaonde (~2.9%) |
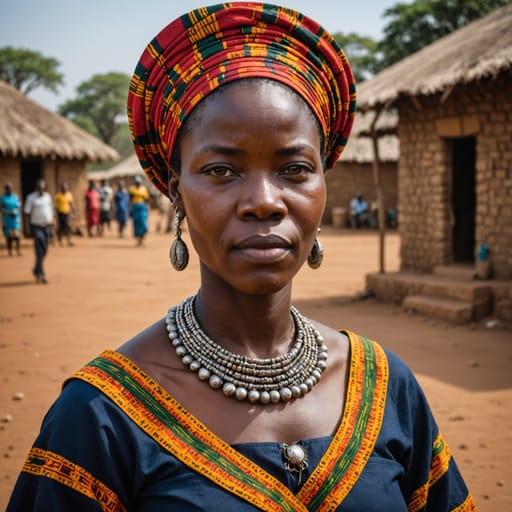 Lunda Zambia Lunda Zambia | 2.8% | Zambia 2022 Census; Lunda (~2.8%); cross-border with Angolan and DRC Lunda |
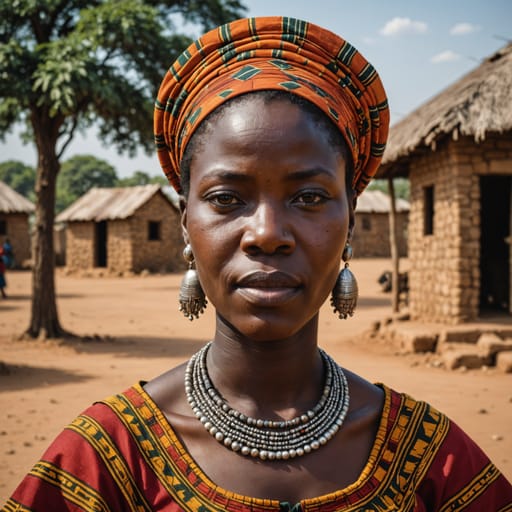 Luvale Zambia Luvale Zambia | 2.2% | Zambia 2022 Census; Luvale (~2.2%); cross-border with Angolan Luvale |
Zambia Phenotype Profile
Zambia has a heterogeneous demographic structure with Bemba (~21%) as the largest single group plus 70+ smaller Bantu ethnic groups.
Zambia Body & Anatomy Reference
Per-feature anatomical profile for AI nude generation: Bantu / Khoisan Southern African phenotype dominant in Zambia
Zambia Women: Boobs & Breasts
Zambia women's tits and boobs reflect the medium cup, full but moderate projection Bantu / Khoisan Southern African bust profile dominant in the Zambia demographic composition. Zambia nipples and areolas show medium-brown to deep-brown areolar pigmentation, with areolar diameter typically in the 30-44mm range, distinct from the the heavier West African bust. Zambia breast morphology trends moderately full; less projecting than West African norm, a function of the mesomorph; Khoisan-descended sub-populations show distinctive steatopygic fat deposition body habitus and mean adult female BMI 24-28. For anatomically-accurate AI-generated Zambia nude women the render should preserve: medium cup, full but moderate projection shape, 30-44mm areolas with regional pigmentation, and the torso proportions of the Bantu / Khoisan Southern African phenotype.
Zambia Women: Ass & Hips
Zambia women's ass and hip morphology presents as the distinctive Khoisan-influenced steatopygic profile in some sub-populations (San, Khoekhoe); broader gluteal projection in Bantu-speaking groups, distinctly different from the slim Cushitic East African profile. Zambia pelvic profile shows wide iliac crests with notable lordosis in Khoisan-descended sub-populations, anchored in the Bantu / Khoisan Southern African skeletal pattern that dominates the Zambia ethnic composition. Zambia butt shots in adult AI imagery should render the the distinctive Khoisan-influenced steatopygic profile in some sub-populations (San, Khoekhoe); broader gluteal projection in Bantu-speaking groups silhouette with the mesomorph; Khoisan-descended sub-populations show distinctive steatopygic fat deposition build and the gluteal-femoral fat distribution typical of the Bantu / Khoisan Southern African phenotype rather than defaulting to a globally-averaged shape that generic AI generators produce.
Zambia Women: Vagina & Pussy
Zambia women's pussy and vulvar anatomy presents deep-brown labial pigmentation; the elongated labia minora documented in some Khoisan-descended populations, consistent with the Bantu / Khoisan Southern African phenotype's pigmentation pattern dominant in Zambia. Zambia pubic hair is typically tightly-coiled coarse texture, distributed in the inverted-triangle pattern with regional-typical density. AI-generated Zambia nude imagery should preserve the deep-brown labial pigmentation; the elongated labia minora documented in some Khoisan-descended populations and the tightly-coiled coarse texture hair texture rather than defaulting to a Western-European pink-and-sparse template. For anatomically-accurate Zambia pussy renders the labial pigmentation should match the surrounding medium-brown to deep-brown skin tone of the Bantu / Khoisan Southern African phenotype.
Zambia Men: Dicks & Penis
Zambia men's dick and penile anatomy in adult AI generation should anchor on the regional reference data: regional mean ~14cm erect, moderate-to-above-average girth, and deep-brown shaft pigmentation. Zambia cock profile reflects the Bantu / Khoisan Southern African ancestral population's anthropometric measurements rather than a globally-averaged Western-pornography default. For anatomically-accurate Zambia nude male imagery the shaft pigmentation should track the surrounding medium-brown to deep-brown skin tone, with continuous glans-to-shaft pigmentation transition and the tightly-coiled coarse texture pubic-hair texture distributed in the typical inverted-V escutcheon. Circumcision status across Zambia men varies by religious and cultural tradition rather than ancestral phenotype.
Zambia People: Body, Curves & Build
Zambia body type and overall build presents as mesomorph; Khoisan-descended sub-populations show distinctive steatopygic fat deposition, with mean adult female BMI 24-28: the characteristic Bantu / Khoisan Southern African habitus dominant in the Zambia demographic composition. Zambia curves and proportions in adult AI imagery should preserve the regional skeletal frame (height, shoulder-to-hip ratio, limb proportions) rather than scaling to a Western-European mesomorph default. The Zambia nude female form, when rendered with anatomical fidelity, shows the height range, frame width, and adipose distribution pattern typical of the Bantu / Khoisan Southern African phenotype. Generic AI image generators tend to collapse regional body types into a few default shapes; the Ethnic Erotic phenotype-anchored approach preserves the Zambia build as its own reference category.
Zambia People: Skin Tone & Hair Texture
Zambia skin tone falls in the medium-brown to deep-brown (Fitzpatrick V-VI); lighter in Khoisan-descended populations band, the surface signal most often miscalibrated by generic AI nude generators trained on Western-photographic datasets. Zambia hair texture is typically tightly-coiled 4A-4C; the distinctive 'peppercorn' tight-spiral texture in Khoisan-descended populations, characteristic of the Bantu / Khoisan Southern African phenotype. For anatomically-accurate Zambia nude renders the skin should hold the Fitzpatrick band consistently across body surface rather than showing the lighter-than-face body shading that AI generators default to. Zambia hair pigmentation and texture on body, pubic, and head should match across the figure rather than mixing textures (a common AI artefact).
A descriptive view, not a claim about individuals
This page shows a weighted aggregate of phenotype observations across the Zambia population, based on demographic composition from published census and ancestry sources. Phenotypes within any country are far more varied than the aggregate suggests; this is a descriptive reference, not a deterministic claim about any individual. For source-level detail on individual ethnic groups, see the constituent atlas pages linked below.
Methodology Notes
Composition weights derived from Zambia 2022 Census.
Primary Sources
- 1.Zambia Statistics Agency. Population and Housing Census 2022. Lusaka: ZamStats; 2023.
- 2.Macola G. Liberal Nationalism in Central Africa: A Biography of Harry Mwaanga Nkumbula. Palgrave Macmillan; 2010.
- 3.Roberts AD. A History of Zambia. Heinemann; 1976.
- 4.Tishkoff SA, Reed FA, Friedlaender FR, et al. The genetic structure and history of Africans and African Americans. Science. 2009;324(5930):1035-1044.
- 5.Lyons T. Insurgents in Suits: Zambia's Bemba Heritage and the African National Congress in Exile. Africa Today. 2013;59(4):85-105.
Other countries in Southern Africa
Aggregate phenotype references for neighbouring Southern Africa nations, weighted by demographic composition.